Introduction
Rice (Oryza Sativa L.) ranks among the most commonly eaten grains, used in various forms, including noodles and products like rice cakes, alcoholic drinks, sweets, and baked items (Chu et al., 2023). As eating habits become more varied and convenience grows, rice consumption continues to decline. Additionally, the increase in single-person and dual-income households has resulted in higher consumption of home meal replacements (KOSTAT, 2022). Transitioning to Westernized diets has led South Korea to maintain a structural surplus since 2000, as annual rice production and imports have repeatedly surpassed domestic consumption.
At the same time, individual rice consumption in South Korea has declined by 17.3%, dropping from 69.8 kg in 2012 to 57.5 kg in recent years (KDCA, 2022). During the 1990s, per capita rice consumption dropped annually by an average of 2.3%, which rose to 2.6% in the 2000s (Kim, 2017). To encourage rice consumption, it is essential to expand its application beyond just a staple food to include its use as an ingredient in processed foods (Choi & Lee, 2007).
The rise in single-person households swiftly refocused domestic rice consumption from traditional table rice to processed alternatives (Ha et al, 2022). The rice processing industry’s market has steadily increased from 4.1 trillion won in 2019 to 7.3 trillion won (KOSTAT, 2022), heightening interest in using surplus rice and rice-based processed foods. Ongoing research centers on bakery products that use these materials (Qin et al., 2021; Fujii et al., 2023).
Bread mainly relies on wheat flour due to the essential gluten proteins it contains (Aljada et al., 2021). Gluten is an alcohol-soluble protein in various grains, including wheat, rye, and barley (Caio et al., 2019), consisting of gliadin and glutenin. Gluten may cause several conditions, such as gluten sensitivity, celiac disease, gastrointestinal issues, and dermatitis herpetiformis, the latter presenting with skin symptoms associated with digestive problems (Shewry, 2019; Šmídová & Rysová, 2022). As a result, gluten-reduced diets are becoming increasingly popular for their purported health benefits (Cannas et al., 2020).
Recent research has investigated the feasibility of using soybeans, corn, and sorghum as alternatives to wheat in bread products (Sun et al., 2019; Woomer et al., 2019; Mariscal-Moreno et al., 2021). Nonetheless, research on using rice as a wheat flour replacement is still scarce (Kim, 2017). Unlike wheat, rice lacks gliadin, preventing the development of a gluten network needed for product cohesion (Honda et al., 2021). Additionally, rice flour quality declines during storage, potentially leading to lipid spoilage and rancidity (Zhao et al., 2021).
“Baromi 2 (B2)” is a new rice variety created by the Rural Development Administration. It results from crossing “Suwon 524,” used for milling, with “Jopyeong,” a versatile variety adapted to upland conditions bred for resistance (Ha et al., 2022). Rice is typically subjected to wet milling for powdered form due to its greater grain hardness than wheat, primarily processed through wet milling following starch gelatinization (Chu et al., 2023). B2 is a dry-milled rice flour that offers cost savings, shorter processing times, and environmental benefits over wet-milled rice flour (Park et al., 2023). In the food sector, powdered rice flour can be used in nonfermented bread, fish cakes with low wheat content, and sausages. Additionally, it can be combined with wheat flour to create fermented bread and other processed foods (Ministry of Agriculture, 2022).
As a result, this research aims to improve the use of B2 in bakery products to encourage rice flour consumption. It evaluates B2’s potential as a wheat flour substitute in white bread while examining its physicochemical properties. Furthermore, the study aims to identify the ideal blending ratio of rice flour as a wheat flour replacement and offers essential data for rice flour processing studies.
Materials and Method
Rice flour was made from B2 supplied by the Rural Development Administration.
The patent application is named “Garumi2.” The hardness value of “Garumi2” is 2.9±0.09 kg. The physicochemical properties of the rice flour produced with the test mill “Buhler MLU-202” include average particle size (μm) 81.8±1.31, damaged starch (%) 5.6±0.11, whiteness (CIE value) 92.3±0.22, ash content (%) 0.59±0.02, protein content (%) 6.6±0.16, and amylose content (%) 18.0±0.59 (Jung et al., 2020).
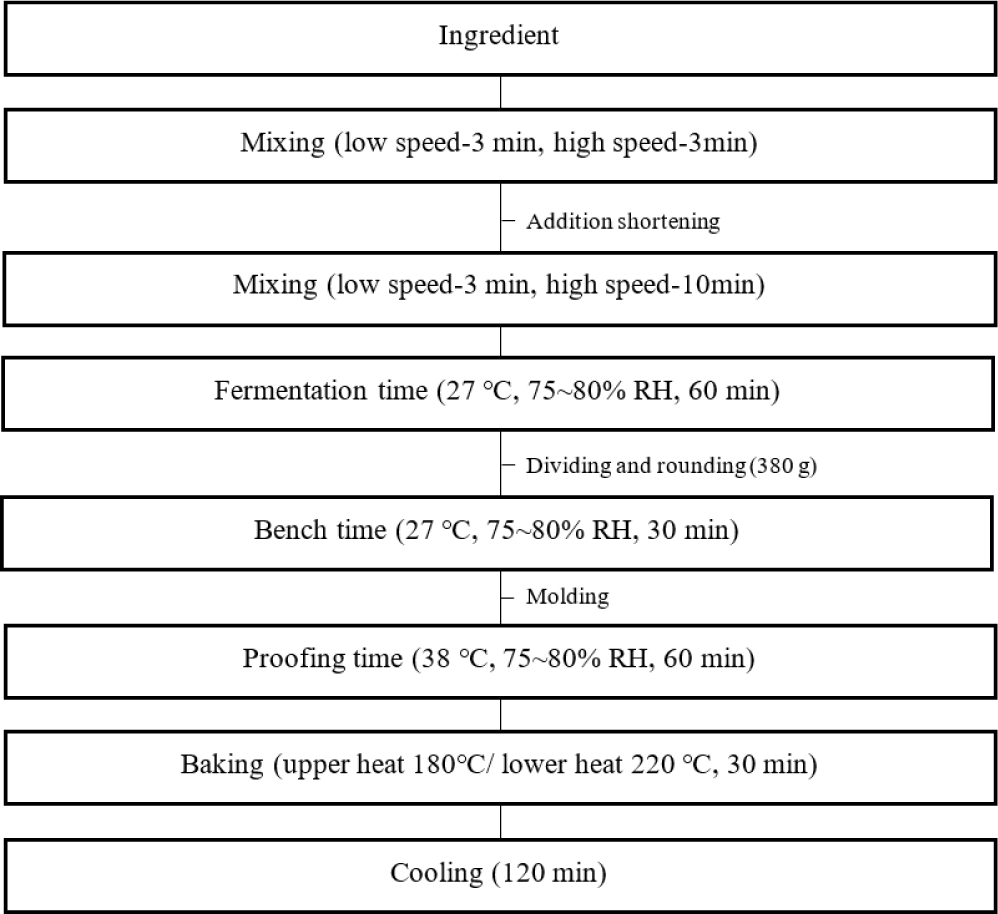
White pan bread samples were prepared using the AACC standard straight dough method with slight modifications (AACC, 2000). The ingredients were as follows: 100 g of hard flour (Daehan Flour Mills Co., Ltd, Incheon, Korea), 4 g of refined sugar (CJ. Inc., Seoul, Korea), 4 g of whole dry milk (Seoul Dairy Cooperative, Seoul, Korea), 6 g of shortening (Samyangsa Co. Inc., Incheon, Korea), 2 g of sea salt, and 0.7 g of yeast (Saf-instant gold, Lesaffre Pte Ltd, France) for the control (RC) sample. For the tests, 20% (R1), 40% (R2), 60% (R3), 80% (R4) and 100% (R5) concentrations of B2 rice flour were added instead of wheat flour (Table 1). We mixed the ingredients for 3 min at low speed and then for 7 min at high speed (SK-20 Mixer, SK Mixer Co., Ltd. Saitama, Japan). The mixed dough was allowed to ferment for 1 h at 27°C with 75%–80% humidity. After sheeting, molding, and proofing for 60 min at 38°C with 85%–95% humidity, the dough was baked at 170°C (upper heat) and 210°C (lower heat) for 35 min (Fig. 1). The finished products were cooled until their internal temperature reached 30°C before conducting the experiments.
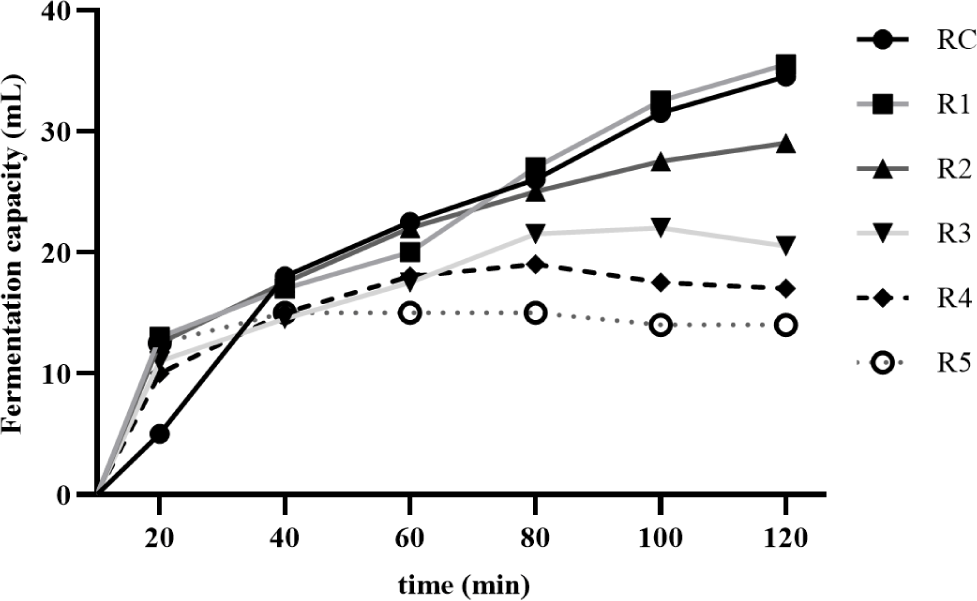
The dough’s pH was measured using a pH meter after mixing 5 g of dough and 45 mL of distilled water (S20 SevenEasy, Mettler Toledo, Leicester, UK). The dough’s fermentation expansion was assessed by placing 10 g of bread dough into a 50 mL conical tube, smoothing the surface evenly, and subjecting it to fermentation for 120 min at 20 min intervals (temperature 27°C, humidity 85%) when measurements were taken. All samples started fermentation at the same volume (9 mL); the highest point of dough expansion was measured every 20 min.
The specific volume of the bread was measured 24 h after product molding using the VOLSCAN VSP300 (Stable Micro Systems Ltd, GU, UK) under the condition of 4 mm/sec. The baking loss rate was calculated using the following formula: the bread dough’s weight and the bread’s weight. All samples were measured five times.
The finished bread’s moisture content was assessed using the Infrared Moisture Analyzer FD-720 (Kett, Tokyo, Japan). A 3.000±0.005 g test sample was placed in an 8 cm diameter aluminum pan. The drying process temperature was maintained at 105°C. Measurements lasted approximately 8 minutes, and results were expressed as a percentage. Each variant was tested in triplicate.
The color measurement of the crust and crumb of white pan bread was conducted using a Chromameter CR-400 (Konica Minolta, Tokyo, Japan) with the CIE L*, a*, b* system. Calibration was performed with a standard white plate, and the measurement diameter was set at 0.8 cm. Each sample had five readings taken. The L* coordinate indicates surface brightness on a scale from 0 to 100, while a* measures color saturation, with positive values representing red and negative values representing green. Positive values denote yellowness for the b* parameter, and negative values indicate blueness. The crust’s Browning Index (BI) was calculated using the L*, a*, and b* parameters (Kupiec et al., 2021).
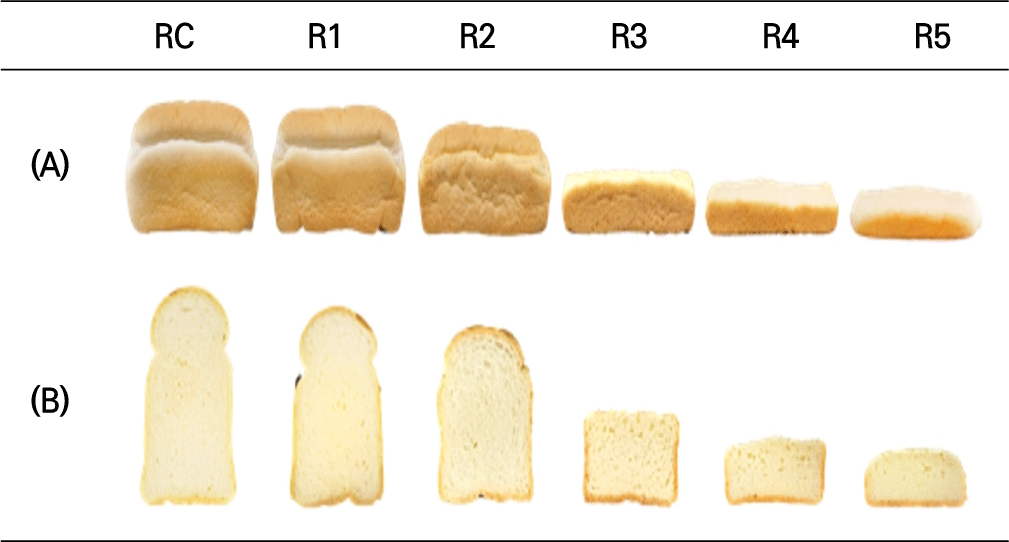
White pan bread crust (see image at the top - A) and its cross-section (see image at the bottom - B): RC-contains 0% B2, R1 contains 20% B2, R2 contains 40% B2, R3 contains 60% B2, R4 contains 80% B2, and R5 contains 100% B2.
The TPA for white pan bread and sweet bread was conducted using the CTX Texture Analyzer (AMETEK Brookfield, MA, USA) with these settings: table speed at 120 mm/min, a maximum load of 2 kg, a compression rate of 50%, and performed under 2-bite conditions. The samples analyzed were 20 mm thick slices taken from the center of the bread. Four parameters were assessed: hardness (N), springiness (mm), cohesiveness, and chewiness (J). Measurements were carried out at 24-, 48-, and 96-hr postmanufacturing.
RC-contains 0% B2; R1-contains 20% B2; R2-contains 40% B2; R3-contains 60% B2; R4-contains 80% B2; R5-contains 100% B2. Each experiment was conducted in triplicate, and the results are presented as the mean±SD.
Results and Discussion
The external structure and attributes of bread containing B2 are displayed in Table 2, Fig. 2, and Fig. 3. Fermentation expansion measurements for the B2-enriched bread products are depicted in Fig. 3. Over a 120-minute fermentation period, the dough volume increased by 23.83 mL for the control group (RC), while R1 showed an increase of 25.33 mL, R2 saw an 18.00 mL rise, R3 increased by 10.5 mL, R4 by 7.25 mL, and R5 by 3.5 mL. The decline in fermentation expansion at higher B2 substitution levels is linked to the reduced gluten content, which is crucial for dough rising. Nonetheless, the data indicates that fermentation expansion can be enhanced at an optimal substitution level. Notably, substituting 20% B2 in the dough resulted in fermentation expansion exceeding that of the control group without negatively impacting the dough’s physical properties (Jun et al., 2019).
Table 2 indicates that increasing the B2 content decreased the bread’s volume and height, accompanied by a rise in weight. The moisture content analysis showed no substantial difference between RC and R1, although a trend was observed where moisture content tended to rise with a higher proportion of rice flour.
This is probably caused by the dough’s diminished ability to retain gas, attributed to lower gluten development, resulting in lesser oven spring and heightened moisture retention (Kraithong et al., 2018). Consequently, the baking loss rate lessened with increased B2 content. The specific volume is a critical measure of bread quality (Monteiro et al., 2021). This study found that the volume of bread with B2 diminished as the substitution level of B2 rose. Additionally, the baking loss rates analysis indicated no significant difference between RC (15.42%) and R1 (14.47%), while R2 showed a lower value (14.01%).
The analysis focused on the bread’s color and varying B2 levels to determine how increased B2 affects it (see Fig. 2, Table 3). Measurements of the crumb color indicated that as the B2 content rose, the L* value of the crumb also increased, with the * value remaining stable across all samples. The Tb* value showed a positive trend alongside the rising B2 content. In summary, while the L* value of the crumb decreased, the b* value increased, suggesting that higher B2 content contributes to a darker crumb color. Conversely, as the B2 content rose, the L* value of the crust improved, while both the a* and b* values declined. The BI, derived from the crust’s L*, a*, and b* values, demonstrated that the crust color lightened with increased B2 substitution levels. These findings indicate that the rate of B2 substitution for wheat flour notably influences the color of the final product.
Rice flour contains lower protein levels than wheat flour, which is naturally rich in carotenoids, contributing to its darker color (Choi, 2010; Baek & Koh, 2014). Changes in crust color can be linked to the higher B2 content. These results are consistent with earlier studies on rice flour-based bread, which indicated that products with rice flour had greater L* values than the control group. Furthermore, from sample R3 onward, the bread crumb displayed larger pores and inadequate fermentation, rendering these samples inappropriate for further analysis.
Texture parameters like hardness, cohesiveness, springiness, and chewiness are essential quality indicators for baked goods consumers (Roman et al., 2020). Among these factors, a rise in hardness is the most noticeable and frequently observed parameter linked to staling (Kim et al., 2019). The texture of the bread with B2 was evaluated 24 hr after baking. Hardness was measured after 4 days of storage, precisely at 24-, 48-, and 96-hr after baking (Table 4). At the 24-hr mark, the texture assessment revealed no significant differences in cohesiveness, springiness, or chewiness among the samples. Regarding hardness at 24 hr after baking, RC measured 37.00 N and R1 measured 38.25 N, while a sharp increase was noted for R2 at 65.87 N. After 48 hr, RC recorded a rise to 45.47 N (up 22.89% from the previous day), R1 reached 52.67 N (up 37.73%), and R2 saw a minimal increase to 75.15 N (1.08%). By 96 hr, RC jumped to 93.45 N (up 105.52% from the prior day), R1 rose to 72.87 N (up 38.37%), and R2 demonstrated a significant increase to 126.35 N (98.01%).
In general, aging occurred at a slower pace with increased B2 content. Even though R2 showed a reduced aging rate, its level was notably high. When R1 is compared to RC, the hardness increase rate saw a reduction of 22.01%. These findings imply that substituting 20% of B2 enhanced the aging rate and the overall aging extent. According to Nivell et al. (2020), the gluten network in bread influences the product’s hardness, while the amylose network helps reduce it. This study concludes that substituting 20% of the wheat flour with B2 in baked goods reduced gluten content, which improved both the degree and rate of retrogradation, ultimately enhancing product quality.
Conclusion
In this study, we investigated the potential of using B2 as a wheat flour alternative to increase rice flour consumption in bread. We compared the physicochemical properties of products with added B2. The fermentation characteristics improved significantly when the B2 substitution rate was kept at optimal levels. Using B2 at a 20% substitution in bread led to impressive fermentation expansion capabilities. The moisture content of the products decreased as the concentration of B2 increased. Color analysis showed that the BI value of the crust lowered with higher B2 levels, making the crust appear brighter. In texture evaluations, bread containing B2 showed reduced staling compared to the control group, with both hardness and staling rates declining at the 20% substitution. This study concludes that about 20% B2 was optimal for fermented bread products. However, thorough optimization is necessary to find the ideal B2 substitution rate and to mix various ingredients while upholding product quality. This research demonstrates the viability of using B2 as a wheat flour substitute, and it is expected that future studies involving different baking enzymes and gluten alternatives will further improve the quality of rice-enriched bread products.


