


Introduction
Metabolic disease such as type 2 diabetes has become one of the serious health risk in recent years. Therefore, much attention has been paid to the foods with a low glycemic index (GI) and high antioxidant content in protecting against disease related an impaired glucose metabolism (Srinivasan et al., 2007). In particular, it is recognized that diabetes can be ameliorated with the high intake of dietary fiber (DF) and antioxidants (e.g. polyphenols and flavonoids), because these bioactive compounds delay blood glucose or prevent oxidative stress (Coney et al, 2005;Latha & Daisy, 2011;Lattimer & Haub, 2010). In recent years, natural antioxidants including phenolic compounds (e.g. flavonoids) have focused on the prevention of diabetes by inhibiting the activity of intestinal α- glucosidase and pancreatic α-amylase (Ranilla et al., 2010). On the other hand, starch-based foods with dietary fibers (DF) have been shown to increase the viscosity of food products and, thereby delay the accessibility of starch granules to digestive enzymes in the digestive system (Angioloni & Collar, 2011).
Tartary buckwheat (Fagopyrum tartaricum) is regarded as a principal crop high in dietary functional ingredients and shown to have beneficial health effects associated with reduced diabetes mellitus and hypoglycemia (Karki et al., 2013). Peng et al. (2019) reported Tartary buckwheat flour has the lowest content of rapidly digestible starch (RDS) and predicted glycemic index (pGI) compared with maize, wheat, and rice flour, which attributed to the strong antioxidant and α- glucosidase inhibition activities of flavonoids. Several reports even showed that Tartary buckwheat contains a high content of DF and flavonoids, including rutin, the major bioflavonoid of buckwheat (Lee et al., 2012). In particular, the flavonoids in Tartary buckwheat contributed to controlling blood glucose and blood lipid levels (Park et al., 2004;Zhu, 2016a;Zhu, 2016b). In addition to the blood glucose and blood lipids, some researchers have found that flavonoids in buckwheat have significant impacts on carbohydrate digestion via inhibiting activity against α-glucosidases and porcine pancreatic α- amylase (Gil-Cardoso et al., 2016;Tadera et al., 2006). Although the relationship between bioactive compounds such as dietary fiber and phenolic compound and diabetes has been previously reported (Bae et al., 2016;Jun et al., 2014;Liu, 2007), there are limited information on which components in buckwheat are more effective in delaying in vitro and in vivo glucose response.
Therefore, the aim of the current study was to compare the effects of two bioactive components, DF and RU from buckwheat on in vitro and in vivo parameters for the digestive behaviors, to evaluate the correlation between the in vitro digestibility and in vivo response using regression models, and finally to explain the reliability of the in vitro assay as a predictor for the in vivo glucose response.
Materials and Methods
The dietary fiber (DF, 95% purity) and rutin (RU, 98% purity) from Tartary buckwheat (Fagopyrum tartaricum) were used in this study (Hunan huacheng Biotech, Inc, Hunan, China). As noted, the pancreatin from porcine pancreas, bile extract, and amyloglucosidase were obtained from Sigma- Aldrich (St. Louis, MO, USA). Total starch assay kit and a glucose oxidase-peroxidase assay kit were purchased from Megazyme International Ireland Ltd. (Bray, Ireland). The allpurpose wheat flour (CJ Co. Ltd., Seoul, Korea) was purchased from a commercial source for use in this study.
The in vitro starch digestibility was measured by replacing 5% and 10% wheat flour in a gel with DF or RU from Tartary buckwheat (Fagopyrum tartaricum). Wheat flour in a gel was replaced with DF or RU at low level of 5% (DF-L or RU-L) and high level of 10% (DF-H or RU-H) by weight, and in vitro starch digestibility were evaluated. The mixtures (3 g) of wheat flour and DF or RU were dispersed in distilled water (10.71%, w/v). The suspensions were stirred continuously for 5 min and then heated in a boiling water bath for 10 min. The in vitro starch digestibility of these gels was evaluated according to method of Minekus et al. (2014) with a slight modification. In brief, the gel sample (5 g) containing the same amount of total starch was suspended with distilled water (15 mL) and stirred at 700 rpm for 30 min. To simulate small intestinal digestion, simulated intestinal fluid (SIF) electrolyte stock solution was made up of 0.8 mL of 0.5 M KH2PO4, 6.8 mL of 0.5 M KCl, 9.6 mL of 2 M NaCl, 42.5 mL of 1 M NaHCO3, and 1.1 mL of 0.25 M MgCl2(H2O)6 in 400 mL distilled water. Prepared SIF (11 mL), 0.3 M CaCl2 (40 μL), 1 M NaOH (0.15 mL), and distilled water (1.31 mL) were added to the samples. And then, pancreatin-bile salt solution (2 g of pancreatin and 0.435 g of bile extract in 12 mL of SIF, 7.5 mL) and amyloglucosidase (0.2 mL per gram of starch) were added. Additionally, the pH of the sample was adjusted to 6.0 with 1 M HCl and the sample was incubated in a 37 °C shaking water bath. Aliquots of 0.1 mL were withdrawn at 0, 30, 60, 90, 120, and 180 min during digestion and mixed with 1.4 mL ethanol. Next, the released glucose content of the supernatant was analyzed using the GOPOD kit. The contents of RDS, SDS, and RS were calculated after intestinal digestion for 20, 120, and 180 min, respectively. Therefore, the hydrolysis index (HI) was evaluated as follows: the percentage of total glucose released from the sample corresponding that of white bread (Goni et al., 1997;Granfeldt et al., 1992).
The fifty female C57BL/6 mice (12 weeks) were purchased from Samtako BIO KOREA (Seoul, Korea). The fifty female mice were individually housed and fed with rodent diet with 60 kcal% fat (Research diets Inc., New Brunswick, NJ, USA) in an approved laboratory animal facility for one week before testing. After an overnight fasting, the mice were administered with DF and RU suspension of low level (500 mg/kg; DF-L, RU-L) or high level (1000 mg/kg; DF-H, RU-H) or glucose (8%, w/v) via an oral zonde needle. Likewise, the blood samples were taken from the tail vein at 0, 30, 60, 90, and 120 min. At that time, the serum glucose levels were measured with the use of a One Touch Select Plus (LifeScan, Johnson and Johnson, New Brunswick, NJ, USA). The experimental protocol was approved by the Institutional Animal Care and Use Committee (IACUC) at the Korean Preclinical Center (CBIACUC-17143AON).
The area under the blood glucose response curve was calculated using the following Eq. (1) according to Jenkins et al. (1981).
All experiments were performed in triplicate and the data are expressed as the mean ± SD. One-way analysis of variance (ANOVA) were performed to compare means by Duncan’s multiple range at p<0.05. Pearson correlations were used to determine relationship between in vitro digestibility and in vivo response. All statistical analyses were carried out using SPSS software version 21 (SPSS Inc., Chicago, IL, USA).
Results and Discussion
The effects of DF and RU from buckwheat on in vitro starch digestibility in wheat flour gels were investigated in Fig. 1(a). The result of this study indicates that the amount of glucose released decreased with increasing level of wheat flour replacement in the gels compared with that of control without DF or RU. Additionally, RU showed lower areas under the glucose release curve than did DF. In particular, the amount of released glucose in RU was significantly decreased in a dosedependent manner (p<0.05), but no notable difference was observed between DF samples. Thus, in other words it was noted that RU had the higher suppression effect on starch hydrolysis between the buckwheat DF and RU used with an in vitro method, suggesting the functional properties of phenolic compound to starch digestion. An et al. (2016) also reported that phenolic compounds are considered to be more highly related than dietary fiber in vitro digestibility of wheat flour gels replaced with black rice. The effects of phenolic compounds on reducing starch digestibility by inhibiting α- amylase activity and interacting with starch have been also described in other studies. Based on these results, the suppressive effects of starch digestibility might be explained by the inhibitory effect of phenolic compound, especially rutin, against the activity of α-amylase (Goh et al., 2015). Navarro-Gonzalez et al. (2011) reported that in vitro starch digestibility of dietary fiber and phenolic compounds have been significantly reduced. Also, the Singh et al. (2010), study reported that dietary fibers made it possible to limit the accessibility of the substrate to digestive enzymes, in this case by acting as a physical barrier and/or by increasing viscosity.
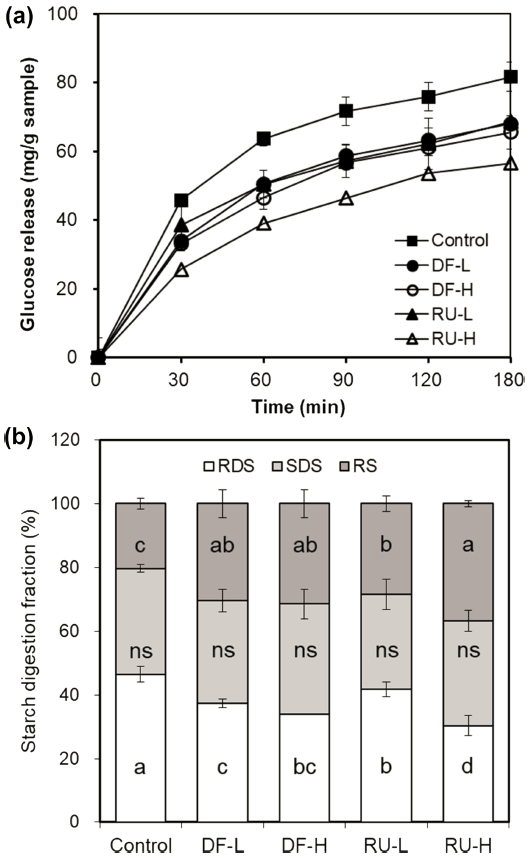
The amount of RDS, SDS, and RS of the gel with DF and RU were calculated depending on the wheat flour level in Fig. 1(b). The RDS, SDS, and RS contents of control without DF or RU were 46.50%, 33.20%, and 20.30%, respectively, which had significantly higher RDS and lower RS contents than gels with DF or RU (p<0.05). Namely, RDS of gels with DF and RU reduced by 37.32→ 33.88% and 41.71→ 30.28%, respectively with increasing replacement level (5%→ 10%) as follows: RU-L > DF-L ≈ DF-H > RU-H. In particular, RDS of the RU gels dramatically decreased with increasing levels of wheat flour replacement (p<0.05), while gels with DF replacement of 5%→ 10% were not seen to have been significantly different (p>0.50). The amounts of SDS were not significantly different (p>0.05) among samples with descending order 34.66 (DF-H) > 32.95 (RU-H) ≈ 32.21 (DF-L) > 29.88 (RU-L). The amount of RS of RU-H (36.78%) was the highest, followed by those of DF-H (31.46%), DF-L (30.47%), and RU-L (28.41%). In this sense, DF showed no significant difference in the value RS with increasing level of wheat flour replacement in the gel (p>0.05). Meanwhile, RS in RU significantly increased at higher replacement levels (p<0.05). Based on these results, for lowering the in vitro glucose response with buckwheat DF and RU, it is seen that RU was more effective than DF in this study.
For the purpose to further compare the influence of DF and RU on glycemic response, an in vivo experiment using a mouse model was carried out. The postprandial glucose levels of mice after intake of glucose, DF, and RU are shown in Fig. 2(a). In this case, the DF and RU showed a significant lower increase in blood glucose levels, compared to the recorded glucose intake, without DF or RU ingestion (p<0.05). The maximum blood glucose was observed at 15 min after ingestion of DF groups, and then which declined sharply during a lower digestion. On the contrary, in this respect, the RU groups reached the highest blood glucose level at 30min following glucose intake, and then declined sharply in RU-L. Additionally, at 30 and 60 min following glucose ingestion, the DF- and RU-H groups had experienced a greater reduction in blood glucose levels than the DF- or RU-L groups, regardless of the sample types used. In particular, it was shown that the rate of blood glucose release of RU-H reached a maximum level within first 30 min after ingestion and then it dramatically reduced during the test period of 2 h. Thus, RU-H resulted in the lowest glucose level, consistent with the identified in vitro digestion data. In summary, as the concentration of DF and RU increased, it was discovered that the blood glucose level decreased, and the amount of reduction was greater with RU than DF. Thus, we demonstrated the effects of RU in the improvement of glucose metabolism.
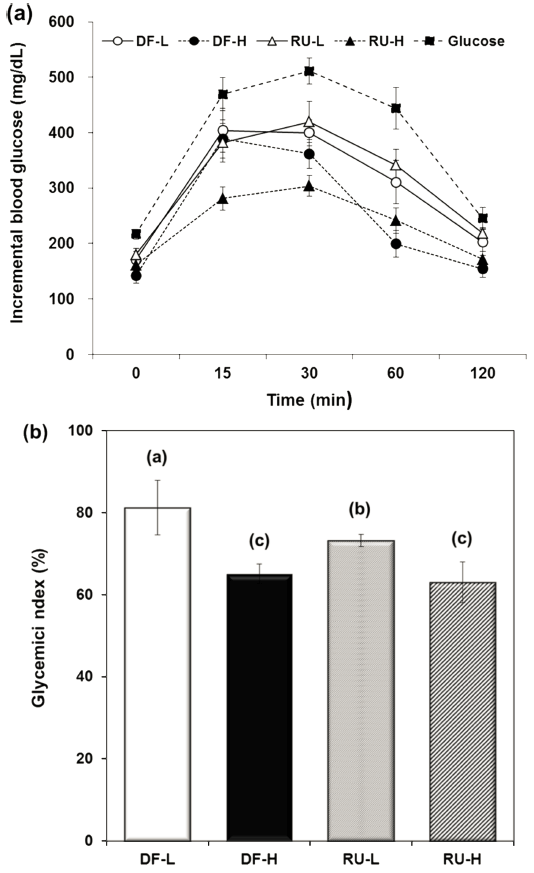
As shown in Fig. 2(b), the GI of DF and RU were calculated on the area under the blood glucose response above the glucose baseline by the GI (Jenkins et al., 1981). The in vivo GIs of DF and RU groups were noted in the following order: DF-L (81.40) > RU-L (74.80) > DF-H (66.63) ≈ RU-H (64.60), with the RU group showing a more significant decrease in the in vivo GIs than the DF group at low concentrations. While no significant difference between the DF-H and the RU-H was observed, it was noted that the in vitro HI values of these samples were significant (p<0.05).
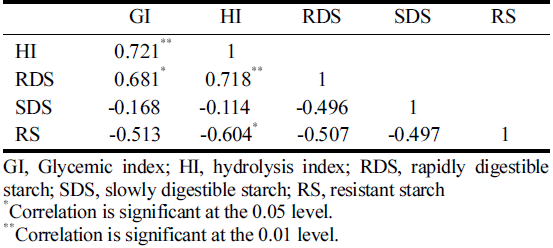
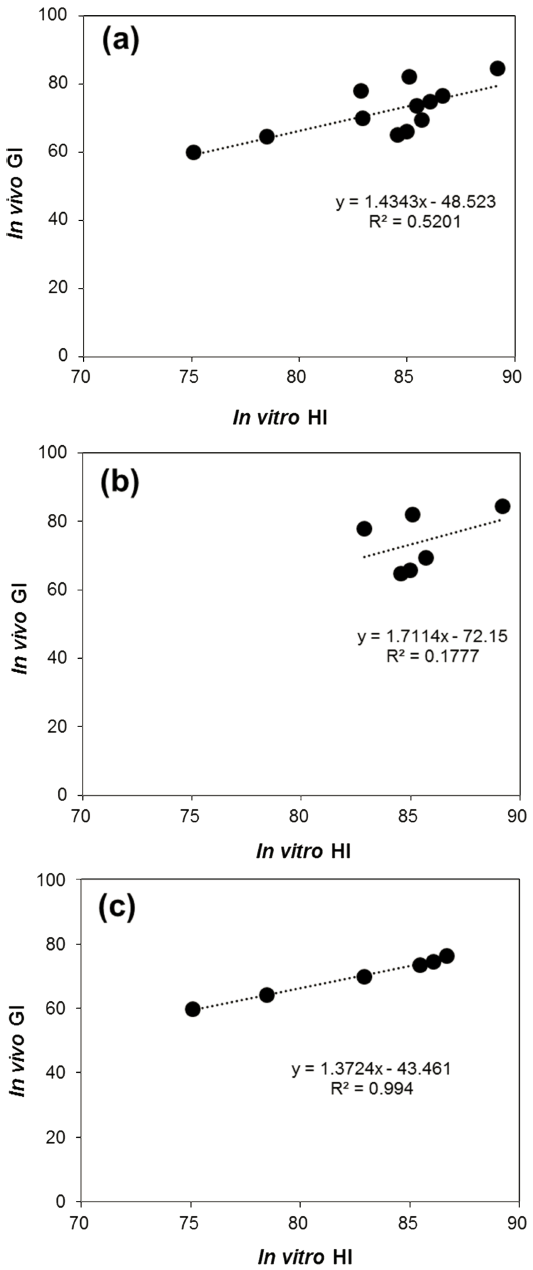
The prevailing discipline used to explain the relationship between the in vitro starch digestive and the in vivo GI data, the Pearson correlations coefficients (r) were analyzed and given in Table 1. The in vivo GI values were positively correlated with HI (r = 0721, p<0.01) and RDS (r = 0.681, p<0.05), whereas SDS and RS values did not correlate with the identified GI value. It is revealed that the higher correlation coefficient was observed between HI and RDS (r = 0.718, p<0.01), whereas it was highly negatively correlated with RS (r = -0.604, p<0.05), and was not correlated with SDS values. In addition, although a weak positive correlation (r = 0.52) was observed between in vitro HI and in vivo GI, the equation was obtained through the relationship as follows: GI = 1.43 HI – 48.52 (Fig. 3(a)). However, as seen the correlation patterns between DF (Fig. 3(b)) and RU (Fig. 3(c)) were noted as being very different; a stronger correlation in RU was exhibited (r = 0.994, p<0.01), whereas there were no correlations in DF (r = 0.177, p>0.01). It appears that the difference of glycemic response between in vitro and in vivo may be related their different GI mechanism of DF and RU, as was identified by increasing the viscosity of digesta and inhibiting the activities of enzymes, respectively.
|
Conclusions
This study demonstrated that comparative hypoglycemic effects of DF and RU from Tartary buckwheat based on in vitro starch digestibility in wheat flour gel and in vivo glucose response in mice. Wheat flour gel with DF and RU reduced RDS by 37.32→ 33.88% and 41.71→ 30.28%, whereas increased RS by 30.47→ 31.46% and 28.41→ 36.78%, respectively, with increasing level of wheat flour replacement. In terms of in vivo starch digestion, RU had lower glycemic index (GI) compared to DF. The regression equation from the correlation with the in vitro and in vivo data from RU was positively correlated (R2 = 0.99). However, the mechanisms by which DF and RU suppressed the in vitro and in vivo GI response are very different, confirming phenolic compounds as more critical factor for improvement of hypoglycemic effect.