Introduction
Extrusion is a high temperature short time (HTST) process to produce commercially shelf stable products, because of low cost, high productivity, energy efficiency and versatility (Angela, 2007). Extrusion has been widely used in the food industry like ready-to-eat cereal breakfast, pet food, pasta, candies (Lin et al., 2007) and texturized vegetable protein (TVP).
TVP is a kind of food products made from edible protein sources and characterized by having a structural integrity and identifiable structure such that each unit will withstand hydration and cooking, and other procedures used in preparing the food for consumption. TVP is considerably similar to meat in taste, color, and structure (Asgar et al., 2010). It could partially or completely replace meat to reduce obesity, hypertension, hyperlipaemia, cardiovascular disease, diabetes, and other modern “civilized disease” (Chen, 2010). Also, it can supply protein for vegetarians or Muslims (Asgar et al., 2010). Therefore, it has drawn great attention.
Soy protein, containing eight essential amino acids, is considered the most popular food ingredients in 21st century (Yu, 2011). Soy protein isolate (SPI) is obtained by removing oil at low temperatures, which contains more than 90% protein (Yu, 2011). SPI is the ideal material for extrusion. Gluten is a wheat protein obtained when separating non-protein components from wheat flour (Sarkki& Tehtaat, 1979). Wheat Gluten (WG) is also one of the main raw materials for producing extruded tissue protein products, which can significantly improve the degree of texturization and fibrosis of texturized vegetable protein (Day et al., 2006). Green tea contains considerable amounts of catechins, which contribute to antioxidant properties (Lu et al., 2010; Shen et al., 2014). Several studies reported that green tea has anti-arteriosclerotic, anti-carcinogenic, and anti-microbial (Wang & Zhou, 2004; Sharma & Zhou, 2011).
It is reported that there are many factors affecting the texturization and formability of the product like feed rate, material moisture, barrel temperature, material pH, screw speed, or protein content (Wei et al., 2009; Maurya & Said, 2014). In this study, Box-Behken Design (BBD) in response surface methodology (RSM) was used to investigate the optimization extrusion variables (moisture content, barrel temperature, and screw speed) on integrity index, nitrogen solubility index, water absorption capacity, hardness, springiness, cohesive- ness, chewiness, and cutting strength of TVP with 15% green tea addition.
Materials and Method
Soy protein isolate (Wachsen Industry Co., Qingdao, China), wheat gluten (Roquette Freres, Lestrem, France), corn starch (Qone Co., Incheon, Korea), and green tea powder (Green tea institute, Hadong, Korea) were purchased. The moisture contents of SPI, WG, corn starch, and green tea were 6.20, 6.20, 10.87, and 6.10%, respectively. SPI, WG, and corn starch were mixed in ratio of 5:4:1 that was determined from preliminary studies. Green tea partially replaced 15% of basic formulation.
The mixture was extruded with a co-rotating intermeshing twin-screw extruder (THK 31T, Incheon Machinery, Incheon, Korea) with a screw length of 690 mm and a screw diameter of 30 mm (L/D = 23:1). The screw configuration is shown in Fig. 1. Feed rate was fixed to 100 g/min during extrusion process. The extrusion variables were set up as follows: M: moisture content (45, 50, and 55%); B: barrel temperature (130, 140, and 150°C); S: screw speed (100, 150, and 200 rpm). The TVP was dried at 50°C for 12 h and was cut to 2±0.2 cm pellet to measure the physical properties. The ground sample (50-70 meshes) was used for nitrogen solubility index.
Integrity index was determined by slightly modified method of Park et al. (2017). Around 5 g of dried samples were soaked in 100 mL distilled water for 30 min at 80°C. The soaked samples were heated for 15 min at 121°C in autoclave (DS-PAC 60, Lab house, Anyang, Korea), then was washed with tap water for 15 s. The washed samples with 100 mL distilled water were homogenized at 14450 rpm for 1 min. The samples were filtered by 20 meshes and dried at 105°C until equilibration.
The soluble nitrogen was extracted from the ground sample (0.2 g) with 10 mL of 0.5% KOH. The mixture was stirred at 120 rpm for 20 min. A subsample was centrifuged at 2000 rpm for 10 min. After centrifugation, 0.1 mL of the supernatant was collected. Total nitrogen was hydrated from the 0.2 g ground sample with 1 mL of 6 N HCl solutions for 24 h at 100°C. After hydration, the mixture was re-dissolved into 10 mL of distilled water and then centrifuged at 3000 rpm for 30 min, then 0.1 mL of supernatant was collected. The soluble and total nitrogen content was analyzed by ninhydrin method. Albumin was used as a standard. nitrogen solubility index (NSI) was presented as soluble nitrogen content divided by total nitrogen content, and multiplied by 100.
Water absorption capability (WAC) was determined by slightly modified method of Lin et al. (2002). The dried samples (5 g) were weighed and rehydrated in 100 mL distilled water for 2 h at 80°C. The rehydrated samples were drained for 5 min by using 20 meshes screen in room temperature and then weighed. The WAC was calculated according to the following equation:
where W1 and W2 are weights before and after rehydration, respectively.
The texture profile analysis (TPA) of TVP was determined by a Texture Analyzer (Compac-100II, Sun Sci. Co., Tokyo, Japan). The TVP samples (2.0×1.0×1.0 cm) were rehydrated for 30 min at 80°C and drained for 10 min in room temperature by using 20 meshes sieve. Hardness, springiness, cohesiveness, and chewiness of TPA were recorded at 60 mm/min travel speed and 10 kg load by using cylindrical probe with 25 mm diameter (Park et al., 2017). Ten replications were measured.
Cutting strength was determined by a Texture Analyzer (Compac-100II, Sun Sci. Co., Tokyo, Japan). The TVP samples (2.0×1.0×1.0 cm) were rehydrated for 30 min at 80°C and drained for 10 min in room temperature. For cutting strength, a knife probe with 2 kg load and 60 mm/min were used to cut the sample. Ten samples were measured.
The optimization experiment was carried out using RSM with a BBD experimental design of three levels and three factors with three replicates at the center point. Different extrusion processes and levels are shown in Table 1. The experimental data for all of responses were analyzed using Design-expert version 8.06 (Stat-Ease, Inc., Minneapolis, Minnesota, USA) software. Significance of results was determined at the p<0.05 level for all data analysis. Experimental model can be analyzed by stepwise and expressed with the following equation:
| Factors | Symbol | Values | ||
|---|---|---|---|---|
| -1 | 0 | 1 | ||
| Moisture content (%) | M | 45 | 50 | 55 |
| Barrel temperature (°C) | B | 130 | 140 | 150 |
| Screw speed (rpm) | S | 100 | 150 | 200 |
with Y representing the estimated response, β0 representing the equation parameters for the constant term, βi representing the linear terms, βij (i,j = 1-3) representing the cross terms, βii representing the quadratic terms for a single variable, and ε representing the random error.
Results and Discussion
The results on the quality of integrity index, nitrogen solubility index, water absorption capacity, springiness, cohesiveness, chewiness, and cutting strength of TVP are shown in Table 2. The coefficient and analysis of variance (ANOVA) at p<0.05 of TVP is shown in Table 3. In order to understand the combined effects of two individual treatment factors on all of responses, the response surface plot is created as the function of two independent variables, while keeping the third one which is the most insignificant factor at the center.
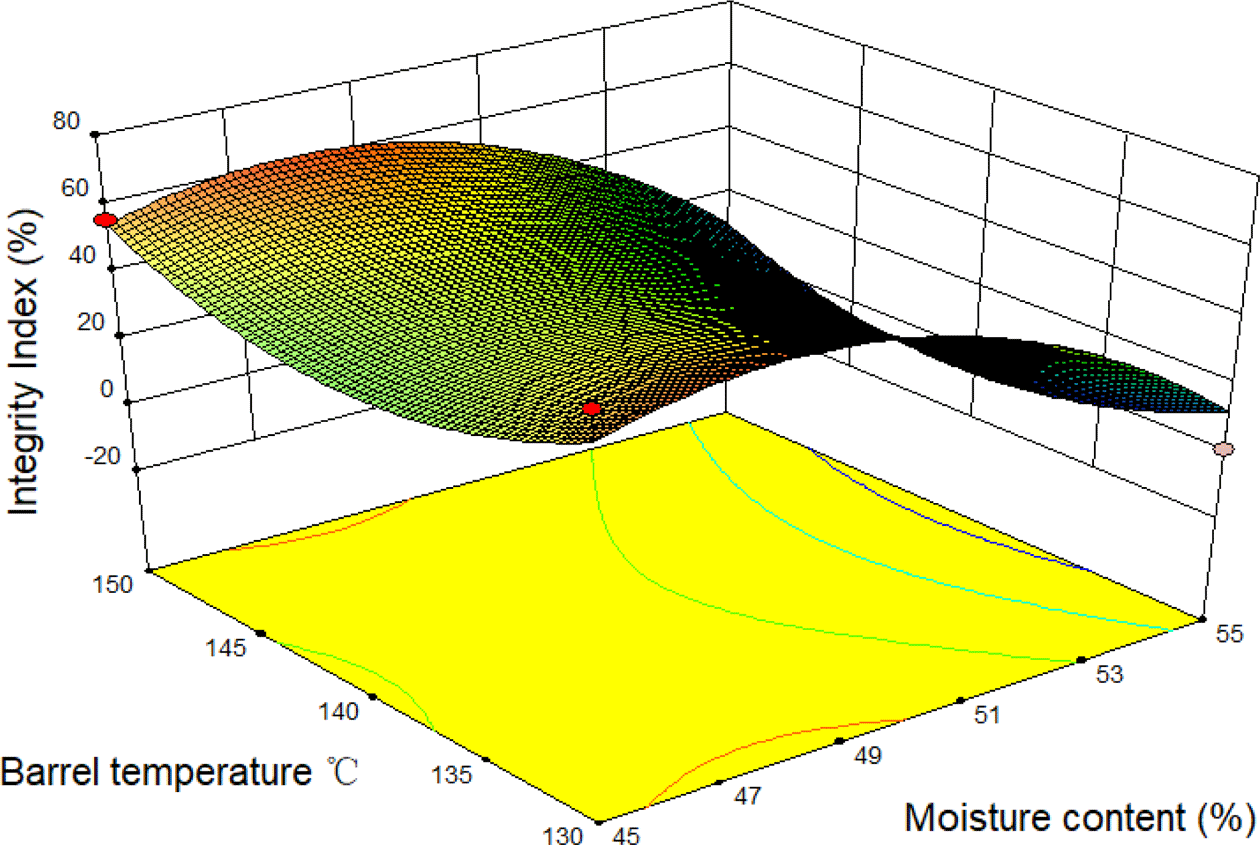
The values of integrity index of TVP are presented in Table 2. The highest value of integrity index was 66.33% when extrusion variables were 50% moisture content, 130°C barrel temperature, and 200 rpm screw speed. The coefficient of predicted model and ANOVA evaluation for integrity index of TVP are shown in Table 3. The independent variables moisture content and quadratic terms of moisture content and barrel temperature significantly (p<0.05) affected integrity index. The regression equation could be expressed as:
According to Fig. 2, the value of integrity index significantly (p<0.05) decreased with increasing moisture content. This result was in agreement with the description of Lin et al. (2002) and Park et al. (2017), who reported that texturization of TVP increased as the moisture content decreased. This might be because increase in friction and shear due to lower moisture content. Therefore, it led to higher degree of texturization and fiber formation (Lin et al., 2002).
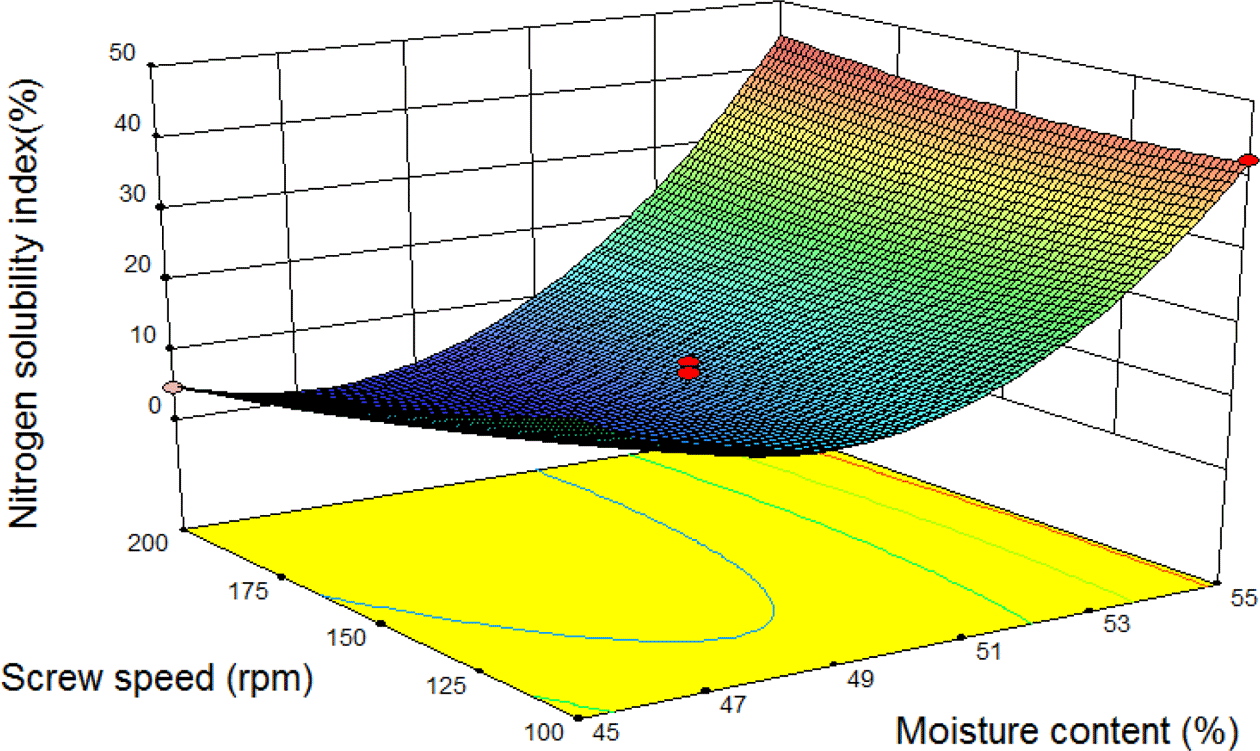
The values of NSI of TVP ranged from 4.12 to 43.03% (Table 2). As shown in Table 3, moisture content and screw speed presented significant effect on NSI. The interaction between moisture content with screw speed also significantly (p<0.05) affected NSI. In addition, moisture content presented quadratic effect on NSI with the regression equation of:
NSI values significantly (p<0.05) decreased with the increase in moisture content and screw speed (Fig. 3). It was consistent with the reported of Park et al. (2017), who claimed NSI value increased as moisture increased from 50 to 55% when SPI and WG were 4:1. This may be because of the high moisture content which decreased protein denaturation and increased in protein solubility (Wei et al., 2009).
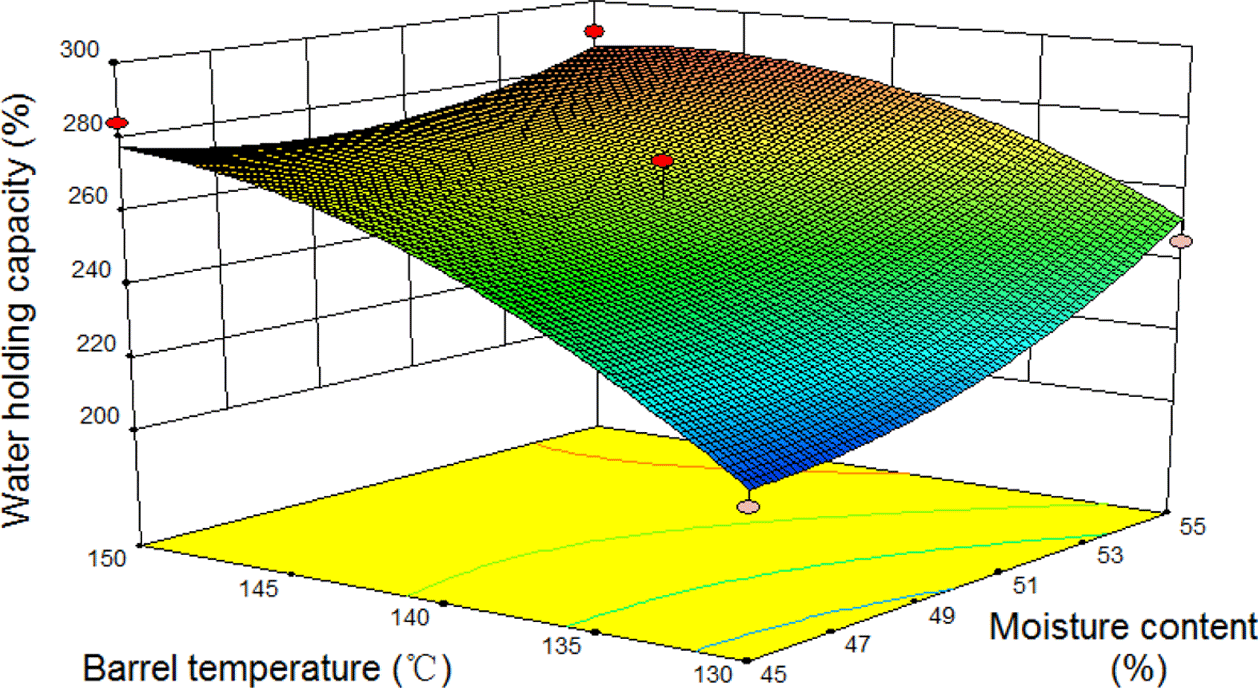
The WAC of TVP is shown in Table 2. The highest value of WAC appeared at 50% moisture content, 140°C barrel temperature, and 150 rpm screw speed. A linear coordination of WAC with moisture content and barrel temperature was observed (Table 3). The equation is expressed as follows:
WAC significantly (p<0.05) increased with the increase in barrel temperature and moisture content (Fig. 4). Sun & Muthukumarappan (2002) and Yu (2011) also demonstrated that higher barrel temperature resulted in higher rehydration rate. Sun& Muthukumarappan (2002) and Seker (2005) didn’t find any significant effect of screw speed on rehydration rate of TVP. Yu (2011) reported that high barrel temperature probably creates more air cells in product. This may cause increased absorption of water during rehydration of TVP, subsequently, the WAC of TVP increased with the increasing barrel temperature.
Hardness is important quality attributes of un-expansion extruded products and depend on structural characteristics arising from extrusion condition. As shown in Table 3, analysis of variance indicated that the extrusion moisture content and barrel temperature were significant to hardness of product. The regression model for process variables and product hardness is shown:
As barrel temperature and moisture content increased, the hardness of products decreased sharply (Fig. 5a). Kang (2007) reported that increasing moisture content within the range of 35-55% could reduce the hardness. We got similar trend with Kang (2007). The samples extruded at 55% moisture had the lowest hardness, which were likely due to more water contained within the samples (Lin et al., 2000).
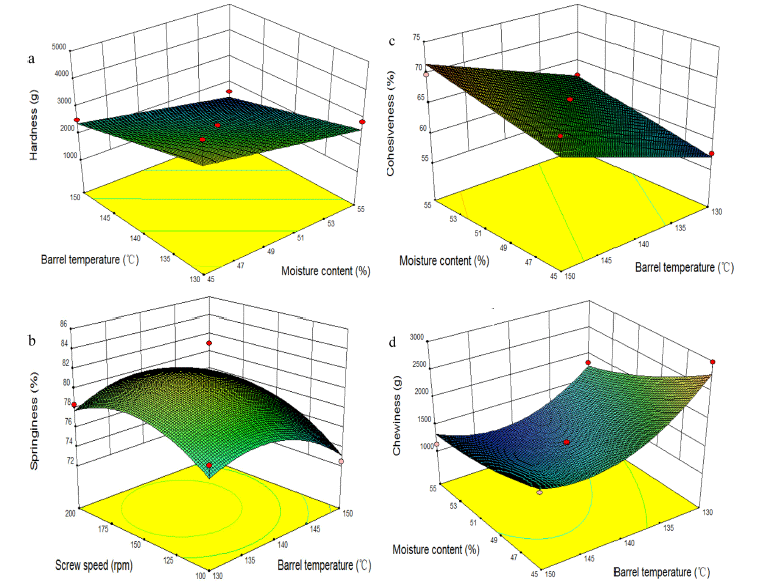
The values of springiness of TVP are presented in Table 2. The springiness ranged between 72.19 and 82.51%. The coefficient of predicted model and ANOVA evaluation of springiness are shown in Table 3. The ANOVA study results showed that model of springiness was not significant meanwhile none of experimental variables exhibited a significant effect on springiness (Table 3). These extrusion variables might not be high enough to significantly change springiness. The springiness response surface plot of TVP is shown in Fig. 5(B). Springiness increased with increasing barrel temperature from 130 to 140°C while it decreased with the increase in barrel temperature from 140 to 150°C. That might be because materials did not reach a molten state under lower barrel temperature. However, the moisture of product was evaporated rapidly under higher barrel temperature, which led to lower springiness.
The experimental values of cohesiveness of TVP products under different extrusion conditions are shown in Table 2. Cohesiveness ranged from 55.79 to 72.84%. Minimum cohesiveness (55.79%) occurred at 50% moisture content, 130°C barrel temperature, and 100 rpm screw speed, while the maximum (72.84%) was obtained at 55% moisture content, 140°C barrel temperature, and 200 rpm screw speed (Table 2). Table 3 shows the coefficient of predicted model and ANOVA evaluation for cohesiveness of TVP. After removing all of insignificant terms, the regression coefficients generated a linear equation:
The response surface plot between cohesiveness and moisture content with barrel temperature at 150 rpm screw speed is presented in Fig. 5(C). The results showed that the cohesiveness increased with an increase in moisture content and barrel temperature. Wei et al. (2006), who investigated the effects of extrusion variables on physical properties of defatted soy meal, reported that cohesiveness increased with the increase in moisture content. It was consistent with our results.
The results of chewiness for different experimental conditions are shown in Table 2. The chewiness of TVP ranged between 996.95 g (55% moisture content, 140°C barrel temperature, and 200 rpm screw speed) and 2,985.91 g (45% moisture content with 130°C barrel temperature and 150 rpm screw speed). The regression model was significant (Table 3). Moisture content, barrel temperature, and the quadratic term of barrel temperature significantly (p<0.05) affected the chewiness (Table 3). The fitted model was created as follow:
Increasing moisture content and barrel temperature, the chewiness significantly decreased (Fig. 5d). Sun (2009), who studied textured soy protein produced by high moisture extrusion technology, claimed that chewiness decreased with increasing moisture content. This was consistent with our result.
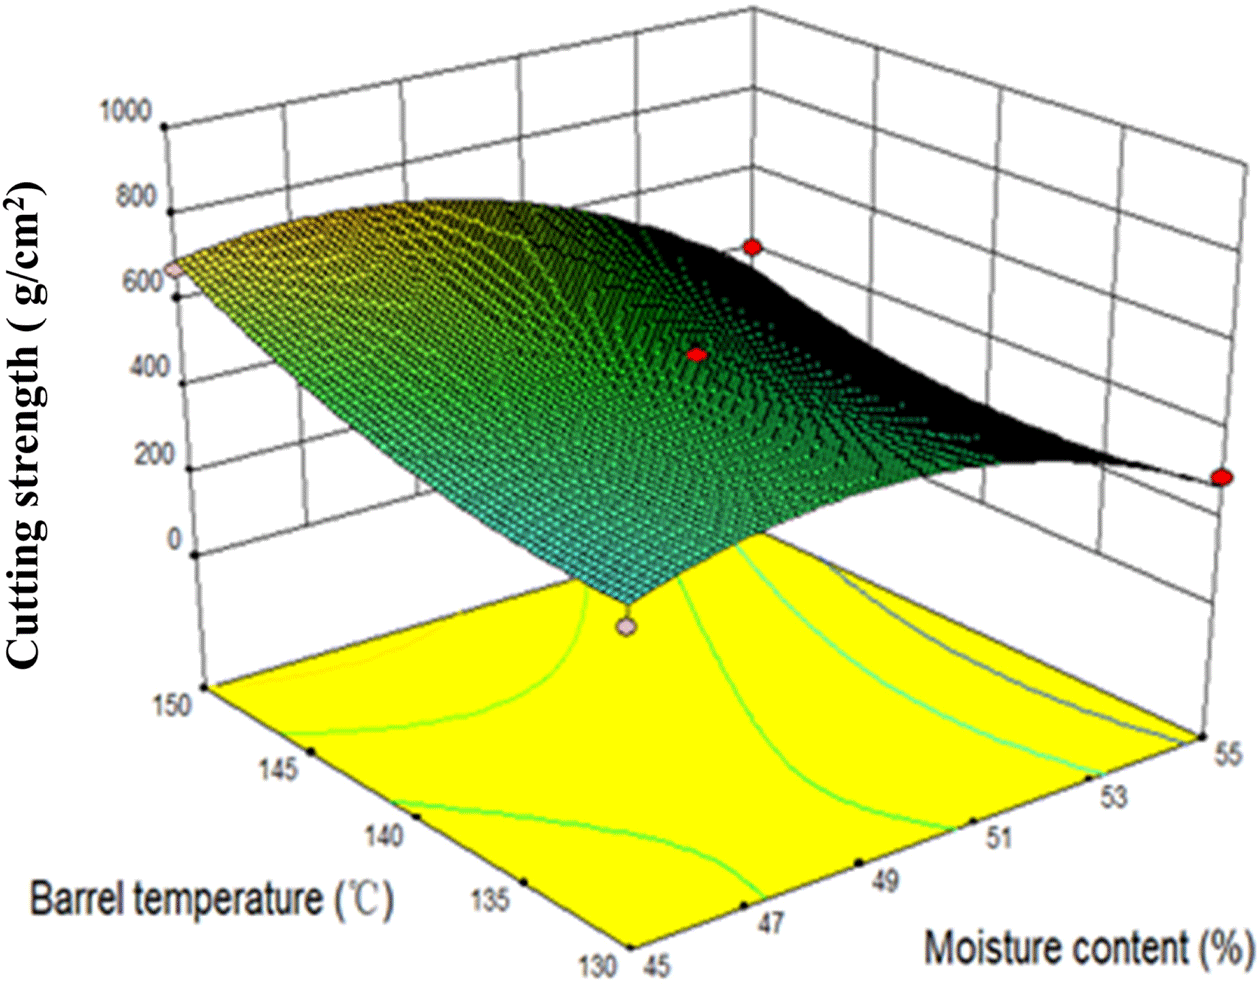
The experimental values of cutting strength of TVP products are shown in Table 2. The highest cutting strength value was 829.52 g/cm2 when the extrusion condition was 45% moisture content, 140°C barrel temperature, and 200 rpm screw speed. As shown in Table 3, the moisture content, barrel temperature, and screw speed were the significant factor. In addition, moisture content, screw speed was also presented the quadratic effect with the regression equation as:
According to Fig. 6, the cutting strength increased with increasing moisture content from 45 to 50% while it decreased with increasing moisture content from 50 to 55%. The higher barrel temperature resulted in higher cutting strength. The sample was cut in cross-linking direction. Higher cutting strength stands for higher integrity index of products, which indicates that it has better texturization degree. Barrel temperature and moisture content could influence the materials viscosity in the barrel and affect the friction between materials and screw. Thereby they seemed to influence the maturation of materials in barrel, ultimately affecting the texture characteristics of the product.
Conclusion
The optimization of three extrusion variables on the quality of SPI, WG, corn flour, and green tea blends were studied. Three important extrusion parameters (moisture content, barrel temperature, screw speed) had different effects. None of the variables presented significant effect on springiness, but hardness, cohesiveness, cutting strength was significant affected by all the three independent variables. Moisture content and barrel temperature exhibited significant quadratic effect on integrity index.
Base on integrity index results, the optimum conditions of TVP given by the model as follows: moisture content 47.78%, barrel temperature 150.00°C, and screw speed 196.05 rpm. Under this condition, the predicted values of integrity index, nitrogen solubility index, water absorption capacity, hardness, cohesiveness, chewiness, and cutting strength by the model were 64.30%, 4.51%, 275.24%, 2067.97 g, 69.68%, 1632.29 g, 863.47 g/cm2, respectively.


