Introduction
The microbial growth prediction models are categorized into a primary model indicating microbial behavior versus time, a secondary model describing a kinetic parameter versus environmental factors, and a tertiary model that predicts a growth curve under specific environmental conditions by combining the primary and secondary models (Stavropoulou & Bezirtzoglou, 2019). Conventionally, the secondary models have considered temperature, pH, water activity (aw), and salt (Na+) (Stavropoulou & Bezirtzoglou, 2019). Quite a few secondary models have been reported. A hyperbola model and an extended hyperbola model were developed to predict the lag phase duration (λ) as a function of temperature (Boekel, 2008). To predict the maximum growth rate (μmax) versus temperature, the Ratkowsky square root model and the Zwietering equation were reported (Boekel, 2008). These models describe microbial growth parameters (λ, μmax) with respect to one variable. The gamma concept-based model and the cardinal parameter model could predict μmax by considering pH and aw as well as temperature (Boekel, 2008).
However, food components, such as sugars, carbohydrates, lipids, and proteins, also influence growth behavior. Factors affecting the growth of microorganisms are classified as external (e.g., temperature) and internal (e.g., pH, water, salt, sugar, carbohydrate, protein, and fat contents of food) (Busta et al., 2003). Sugars are the most fundamental nutrient for microbial growth because most microorganisms can metabolize the saccharides, such as glucose, to produce energy (Busta et al., 2003). Sugars are also an important factor affecting the growth of microorganisms because if the sugar content is high, the aw is lowered and sometimes interferes with the growth of microorganisms. Most foodborne pathogens will first metabolize simple carbohydrates and amino acids, followed by the rest of the nutrients (Busta et al., 2003). These nutrients become vital energy, carbon, and nitrogen resources to produce cellular components through enzyme activity and biochemical reactions for the growth of microorganisms (Busta et al., 2003). These core nutrient contents can determine microbial growth rate, especially at low temperatures, making them more nutrientdependent, and a low nutrient content affects microbial growth at optimum temperatures by limiting microbial growth (Erkmen and Bozoglu, 2016). Food nutrients also affect microbial death. A high-fat content provides some protection against the death of Salmonella species at the killing temperature (Finn et al., 2013). As such, the effect of food components on microorganisms cannot be ignored (Boekel, 2008). Therefore, it would be desirable to consider the above factors (sugar, carbohydrate, protein, and lipid contents) as well as the conventional ones (temperature, pH, aw, and Na+) in the growth models.
The Pathogen Modeling Program (PMP) is a tertiary model developed by the U.S. Department of Agriculture Agricultural Research Service (USDA ARS) to predict microbial growth based primarily on a microbial culture medium rather than food components. However, as more and more influencing variables are included to encompass the complex and variable nature of food, the food environment, and the food microbiome, it becomes increasingly challenging to predict bacterial behavior (Hiura et al., 2021). To overcome the limitations of existing microbial prediction models, artificial neural network (ANN) techniques were introduced (Hajmeer et al., 1997;Oscar, 2009;Oscar, 2021;Hiura et al., 2021).
Two main advantages of ANN are that their application does not require a priori knowledge of the process, and they are effective for predicting networks with multiple input and output factors of discrete nonlinear data (Bourquin et al., 1998). Stangierski et al. (2019) developed an ANN that used five variables to model the overall quality of Gouda cheese during storage and showed that the model had better prediction performance than a multiple regression model.
To build an ANN, it is critical to use many high-quality data. Hiura et al. (2021) developed the eXtreme gradient boosting tree (XGBoost)-ANN for predicting the growth and survival of Listeria monocytogenes in food by applying machine learning classification using ComBase-based viable count data. ComBase is a formatted database (DB) containing a large amount of data on microbial responses to environmental conditions. Eight input variables selected from ComBase that included numerical data types (temperature, pH, aw, time, and initial cell number) and categorical data types (food category, food name, and whether initial cell number or not) were used to develop the XGBoost-ANN model. This research demonstrated that the accumulated data in a DB could be useful for predicting bacterial population behavior (Hiura et al., 2021). It is expected that the predictions will be further improved if numerical data of food component contents, rather than categorical data for food, are used directly in ANN modeling.
The data required to develop a microorganism prediction model using ANN can be collected from online DBs, such as ComBase, FoodData Central maintained by the USDA, and the Food Composition Database (FCDB) maintained by the Korea Ministry of Food and Drug Safety (MFDS). These DBs provide information on the content of components, such as moisture, carbohydrate, protein, fat, and minerals, in agricultural and livestock products, aquatic products, and processed foods (MFDS, 2020;USDA, 2020).
In this study, a secondary model for predicting the growth parameters of Salmonella enterica was developed using ANN. Dependent variables were λ and μmax. More independent variables (sugar, carbohydrate, lipid, and protein contents of food) were considered in addition to the conventional secondary model variables (temperature, pH, and Na+ and water contents). All data were retrieved from ComBase and FoodData Central and cleansed to increase the ANN model prediction accuracy. The ANN models were built, and their prediction accuracies were evaluated.
Materials and Methods
The Salmonella growth parameter data were collected from ComBase (https://www.combase.cc), and food components data were obtained from FoodData Central (https://fdc.nal.usda.gov/index.html). In ComBase, the microbial growth environments are either foods or microbial media. For this study, only the growth data in food were collected. The growth data were provided in the forms of growth parameters (λ and μmax) or growth curves. For the growth curves, growth parameters were estimated using ComBase’s online DMFit fitting tool (https://browser.combase.cc/DMFit.aspx) because the input variables in ANN modeling are growth parameters, not growth curves. Online DMFit is a first-order model-based fitting tool, such as the Baranyi and Roberts model or the trilinear model. The growth curves in the form of images were digitized using a plot digitizer 2.6.9 software. The food component data corresponding to microbial growth data in ComBase were collected from FoodData Central.
To improve the prediction accuracy of ANN, data cleansing was performed to remove data with missing values and outliers among data of output variables (Ridzuan et al., 2019). Data that included missing values were removed first. Data containing outliers were removed by selecting the values determined arbitrarily during the data collection process and those with a z-score greater than 3.0 and less than -3.0. z-score was calculated as follows:
where Zi is the z-score of xi, xi is the output value of a single data, and μ and σ are the mean and standard deviation of all data, respectively.
The ANN model was built using NeuralWorks Predict (NeuralWare, Carnegie, PA, USA), an Excel add-on program. The ANN was based on a backpropagation algorithm, which performs leaning on a multilayer feed-forward neural network (multilayer perceptron). Dependent variables were set as the input variables for ANN: temperature (°C), water content (%), pH, and Na+, sugar, carbohydrate, lipid, and protein contents (%) of food. Independent variables were set as the output variables: λ (h) and μmax (1/h). Data were split into training (80%), validation (10%), and test (10%) data. Using the program, level options should be chosen for “noise level”, “data transformation level”, “variable selection level”, and “neural network search level”. By adjusting each level, the criteria for ANN learning and construction can be changed selectively. To determine the optimum levels, the root mean square error (RMSE) values were compared. RMSE values were calculated as follows:
where n is the number of data, Ri is the actual value of a single data, and Pi is the predicted value of a single data.
Results and Discussion
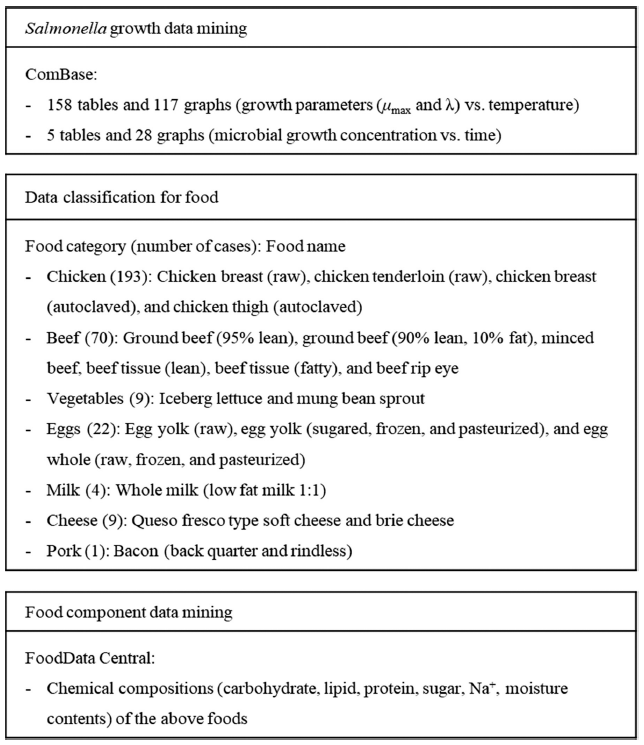
ANN modeling has the advantage of excellent predictability because it can include many variables. In this study, the ANN has a feature that includes food components. Two main DBs were available to access Salmonella growth data online: ComBase and MediaDB (https://mediadb.systemsbiology.net, System Biology) (Fig. 1). According to environment variables, Salmonella data were 8,463 in ComBase, including research paper and agency-funded data, and 70 in MediaDB. ComBase includes both food and microbial medium environments for microbial growth, whereas MediaDB contains only the microbial medium environment. In this study, only food-based data were initially collected from ComBase because Salmonella growth in microbial media cannot represent the growth in foods with different components and where bacteria other than Salmonella may also be present. Then, only data from research papers were selected because the papers provided detailed information on target food and experimental conditions, unlike agency-funded data. The total number of collected data sets was 308 (Fig. 1). The form of the microbial growth data varied: 158 tables and 117 graphs showed microbial growth parameters (λ and μmax) versus temperature, and 5 tables and 28 graphs showed microbial growth curve data versus time. Data from 33 microbial growth curves were regressed with DMFit using the Baranyi model to calculate growth parameters. In addition, the different units of growth parameters between the reference sources were unified. The λ were easily unified in time (h or day) in all data. Most of the μmax were expressed in units of 1/h, but some in doubling time. In the case of ln(N/N0)/time instead of log10(N/N0)/time, μmax was divided by 2.303 due to, log10(x) = . When the growth rate was expressed as 1/doubling time, it was multiplied by log10(2) due to log10(2) = μmax × [doubling time].
In ComBase, Salmonella strains were very diverse, such as Salmonella spp., including S. enterica serovars Typhimurium, Enteritidis, Newington, and Derby. All these were used as data for ANN modeling. According to Lamas et al. (2018), 99% of human salmonellosis is caused by more than 1,500 serotypes of S. enterica subsp. enterica. Oscar (2000) compared the growth rates of 11 strains of S. enterica in sterile ground chicken breast burgers. The coefficient of variation (standard deviation/mean) was 9.4% and 5.7% for λ and growth rate, respectively. This indicates that there is no problem using the data of various serotypes of Salmonella in ANN modeling.
ComBase contains information about food category, food name, temperature, pH, Na+, aw, and reference source. The target food categories for Salmonella growth were chicken (193 cases), beef (70 cases), eggs (22 cases), cheese (9 cases), vegetables (9 cases), milk (4 cases), and pork (1 case). Food component contents for the food category and food name (e.g., chicken and raw chicken breast) were obtained from FoodData Central. Temperature and pH provided by ComBase were directly used. Na+ content and aw were missing in ComBase in many cases. Na+ content was obtained from FoodData Central, and aw was replaced with water content. The aw is associated with water, salt, and sugars (Ziegler et al., 1987). As the Na+ content was considered and sugars were also included in the food components, it is deemed that there would be no major problem even if water content was used instead of aw.
The data cleansing process for missing values and outliers followed the option selection to improve the ANN prediction accuracy. If it belonged to missing values or outliers regardless of λ and μmax, the case was excluded because a case is composed of a set of λ and μmax. μmax had no missing values, and l had 44 missing values out of 308. An outlier was judged in two ways. First, the outliers were the cases where λ seemed to be ignored as zero because the measurement interval was day. Four out of 264 cases (= 308 - 44) were outliers of this type. Second, the case where either the z-score for λ or μmax was beyond ±3.0 was an outlier (Shiffler, 1988;Smiti, 2020). Five out of 260 (= 264 - 4) cases for λ were outliers of this type, whereas the μmax had no outliers. Finally, 53 (= 44 + 4 + 5) data with missing values and outliers were excluded, and 255 data (= 260 - 5) were used for ANN modeling with cleansed data.
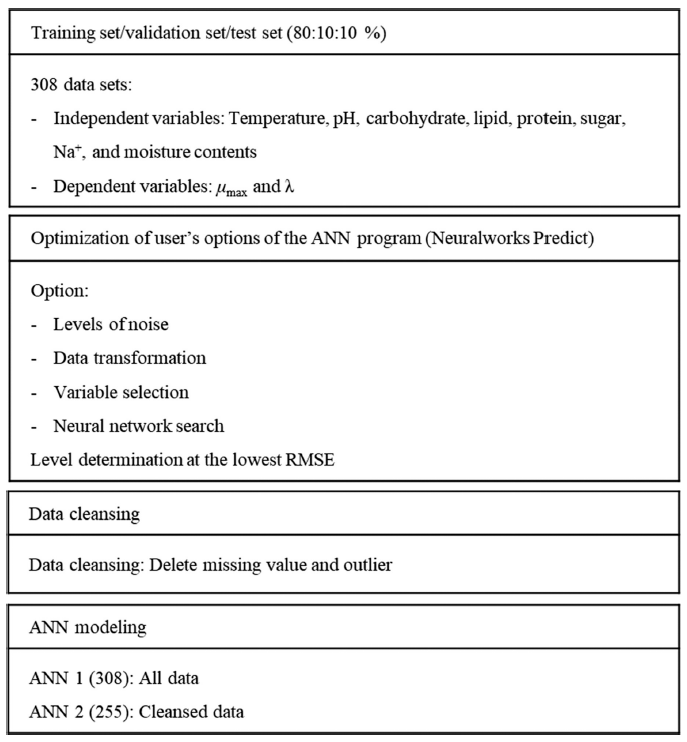
The ANN modeling procedure is summarized in Fig. 2. The user’s option of NeuralWorks Predict was 400: 4 × 4 × 5 × 5 levels for noise level (option A), data transformation level (option B), variable selection level (option C), and neural network search level (option D), respectively. Option C was fixed to “no variable selection”, and option D considered only 4 levels except for “no network search”. By selecting “no variable selection”, the undesirable case of automatically selecting all or only some of the input variables was excluded. “No network search” was excluded because if this option is selected, a neural net of algorithms will not be trained, and only the result of the variable selection is presented. Therefore, the number of possible final option cases was 64 (4 × 4 × 1 × 4). To select the optimal option, an ANN model was built for each option using all data of 308 data sets. The difference between the actual and predicted growth parameters from each ANN model was evaluated in terms of RMSE. The lowest and highest RMSE (λ and μmax) and their sum were 13.760, 0.141, and 13.901 at the 2-2-1-4 level and 35.450, 0.125, and 35.575 at the 2-2-1-5 level for A, B, C, and D, respectively. Therefore, the option at the 2-2-1-4 level for A, B, C, and D was adopted in ANN modeling.
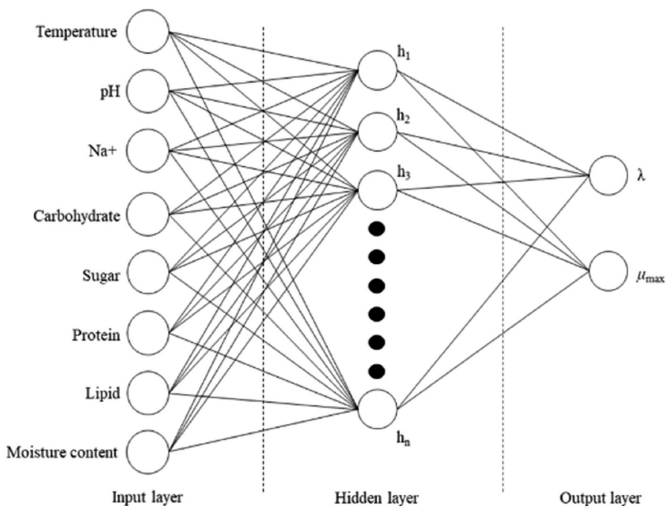
Two groups of all data and cleansed data were applied to build the ANN models. The number of data for ANN should generally be very large, but the data amount in this study was insufficient. The reason was that the data that could be referred from ComBase were limited due to the difficulty of testing food poisoning bacteria in food. The data were split into 80% training, 10% validation, and 10% test data. A training (including validation)/testing splitting ratio of 80:20 is commonly used, but there are other ratios, such as 70:30, 60:40, and 50:50 (Vrigazova, 2021;Joseph, 2022). In ANN modeling, when the number of data is small, it is common to reduce the number of training data to prevent overfitting. However, if the number of data is too small, there is a possibility of underfitting, so there is a limit to reducing it (López et al., 2022). With the train validation split, the hyperparameters (the number of hidden layers, nodes, and epochs) are determined optimally (Yoo, 2019). Train/test split is a model validation process that allows to simulate how the model would perform with new data. The number of hidden layers and nodes of each ANN was automatically determined by the program (Fig. 3).
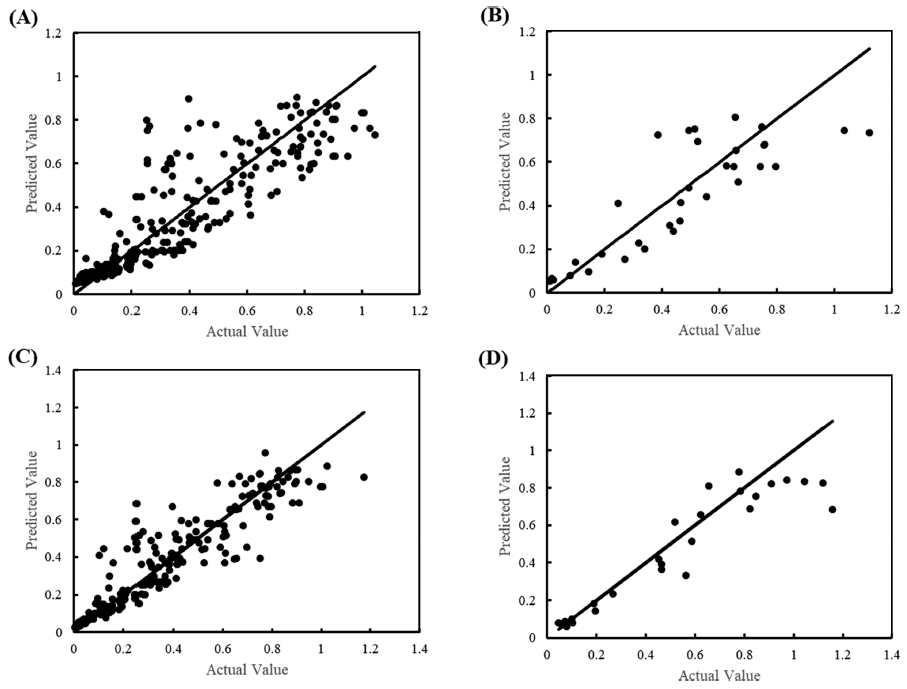
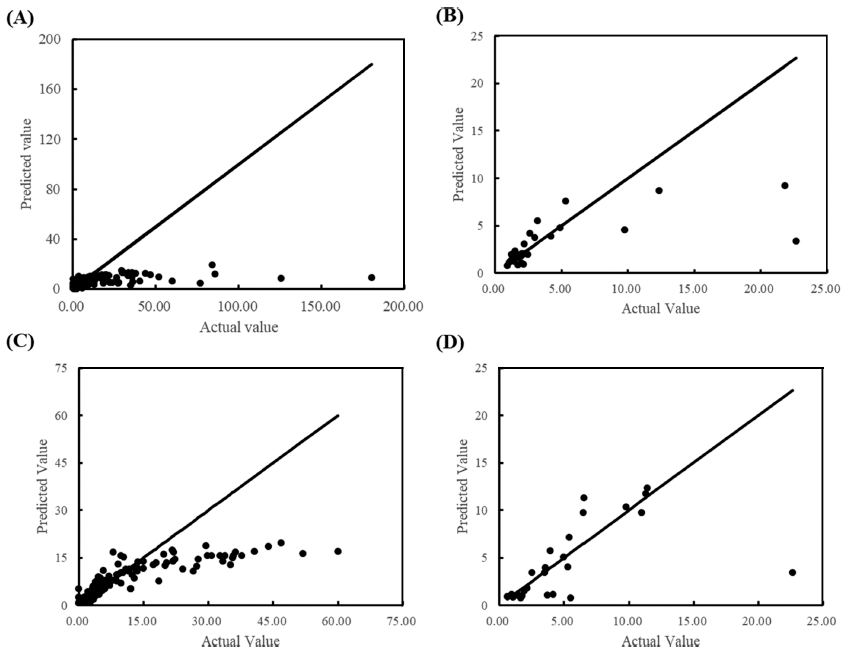
The goodness of fit was described in terms of RMSE. The training/testing RMSE for μmax were 0.14/0.16 and 0.11/0.14 for all data and cleansed data, respectively. This indicates that data cleansing improved the prediction accuracy (Fig. 4). Ölmez and Aran (2005) found that the RMSE was 0.27 in the μmax prediction of Bacillus cereus using temperature (8, 15, 26, and 32°C), pH (5.3, 5.8, 6.3, 6.8, and 7.3), and concentrations of sodium lactate (0, 200, 400, and 600 mM) and sodium chloride (85, 342, and 600 mM). Lee et al. (2021) reported an RMSE of μmax of 0.1-0.35 in the prediction model of Salmonella species growth in cakes. In the ANN-based predictive model for Salmonella growth developed in the current study, the RMSE of μmax ranged from 0.11 to 0.16, being good in predictive performance compared to the above references. However, there was a tendency for overfitting that although the RMSE of training data is small enough, that of test data is still high. Overfitting occurs when the ANN model is fitted even to noise data (López et al., 2022).
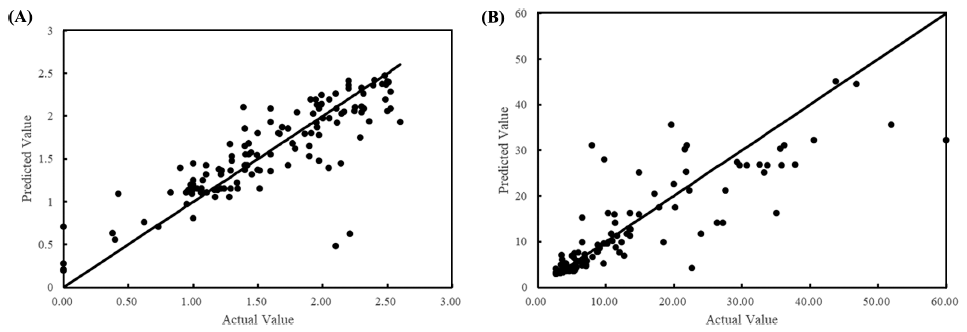
The training/test set RMSE of λ were 11.94/33.03 and 7.09/4.18 for all data and cleansed data, respectively. Although the prediction accuracy was improved by data cleansing, it still showed underfitting. Due to the nature of ANN, it is possible to increase the prediction accuracy for training data by further training with epoch number increased. However, with further training, an overfitting problem occurs, and the final model is completed by stopping training at the optimal number of epochs. In the case of λ, it was judged that the completed model could not be used as a predictive model as it is because the degree of fitting was low. Conversely, as shown in Fig. 5, the goodness of fit was high in a small range of λ but low in a range of larger λ. Focusing on this point, rather than one universal model, models for each range were developed by dividing it into two. As shown in Fig. 6, it was found that the fitting with all cleansed data was improved by dividing it into two models. The RMSE of each model was 0.325 and 6.022 for the λ ranges from 0 to 2.60 h and 2.61 to 60 h, respectively.
The complexity of developing a model to predict λ is discussed as follows. μmax is a reproducible parameter for the same environment and microorganism, whereas λ varies depending on the microbial cell history, even for food with the same environmental parameters (Ross et al., 2014). μmax can be reproducibly obtained experimentally, but λ cannot (Baty et al., 2004). Because the log phase with μmax on the microbial growth curve is after bacteria have already started to grow, μmax can be obtained when bacteria are in a normal state. Conversely, because the lag phase with λ is before bacteria have reached a steady state, even the same bacteria may be affected by the age of bacteria or the history of the previous environment when testing the microbial growth curve. Therefore, the variation of λ seems inevitable, and thus λ might be difficult to accurately predict with one model.
In conclusion, secondary models of Salmonella growth in food were developed by using ANN. Only food data were selected among the microbial growth data in food and microbial medium from ComBase. According to the advantage of ANN, which can include many independent variables, data on food components (sugar, carbohydrate, lipid, and protein contents) were added to the independent variables in addition to the conventional variables (temperature, pH, Na+, and water contents). In ComBase, for μmax and λ, which are dependent variables, the data are presented not only as a number but also as a microbial growth curve, and in the latter case, the numbers were obtained through regression analysis. The prediction accuracy of the ANN model was high in the case of μmax but very low in the case of λ. In the latter case, the prediction could be improved by dividing λ into two ranges and building an ANN model for each. In this study, the total number of Salmonella growth data obtained from ComBase to date was rather insufficient for use in ANN. Continuous development of the ANN models is required by applying more data as it is accumulated in the future.


