Introduction
Synthetic organic dyes are widely used in the production of foodstuffs, pharmaceuticals, leathers, and textile industries to promote sales by improving the appearance (de Andrade et al., 2014;Dotto et al., 2015). Additionally, more than 100,000 synthetic organic dyes and 0.7 million tons are annually produced (Tahir et al., 2017). The effluent discharge of synthetic organic dyes into the environment acts as serious water contaminations. Among the synthetic organic dyes, azo dye accounts for 60-70% of the total consumption (Raval et al., 2016;Sarim et al., 2019).
Synthetic azo dyes contain one or more azo linkages (RN= N-R’), and they are mainly classified as a directive dye. The synthetic azo dyes have carcinogenic, teratogenic, allergies and mutagenic problems (de Lima et al., 2007;Giorgetti et al., 2011). Congo red (CR, Direct Red 28) is one of the synthetic azo dyes and most widely used commercially, which is an anionic and highly stable compound to light and oxidizing agents (Bhattacharyya et al., 2015).
Various treatment methods are used to remove dyes such as physico-chemical (membrane process, photochemical degradation and ionic exchange) and biological (biosorbent) treatments (Othman et al., 2018). Among the previously reported treatment methods, adsorption is the most promising technique compared to the physico-chemical process due to its economical and eco-friendly process and not producing toxic by-products (Mittal et al., 2013).
In previous studies, adsorption of CR dyes has been reported by various bacterial species and numerous adsorbents such as Bacillus subtilis HAU-KK01, Aspergillus carbonarius M333, Penicillium glabrum Pg1, kaolinite and montmorillonite (Bhattacharyya et al., 2015;Bouras et al., 2017;Sarim et al., 2019). Especially, biosorption using a dead or inactivated microbial biomass is regarded as a more attractive method because it is not affected by the CR dye toxicity.
In this work, we isolated and identified Bacillus licheniformis SRCM 120569 from Makgeolli with a high capacity for CR dye adsorption in an aqueous solution. The influence of the adsorption parameters such as the dried biomass dosage, various initial pH levels, contact time, and initial CR dye concentrations were investigated. Fourier transform infrared spectroscopy (FT-IR) analysis was performed to confirm the biosorption behavior of CR dye. Furthermore, biosorption isotherm and kinetic studies were conducted to determine the biosorption behavior of the CR dye on the Bacillus licheniformis SRCM 120569 biomass.
Materials and Methods
CR dye biosorption bacteria were isolated from Korean turbid rice wine (Makgeolli) samples. In previous studies, a lot of bacteria were isolated from fermented rice wine showed some positive effects such as probiotic ability, antipathogenic or superior enzymatic activities (Park et al., 2015;Sim & Kim, 2016). For securing superior bacteria from Korean traditional fermented products, we purchase makgeolli samples from the local market, Sunchang, Korea. It was manufactured using the Schisandra Fruit (Schisandra chinensis, 2.4%), and the product contained 6.5% alcohol. One ml of a Makgeolli sample was serially diluted to isolate the strain using sterilized 0.85% saline solution and spread onto LB (Luria-Bertani) agar plates. The LB agar plates were incubated at 30°C for 24 h, and single colonies were isolated. Among the isolated strains, SRCM 120569 biomass showed a high biosorption capacity for CR dye.
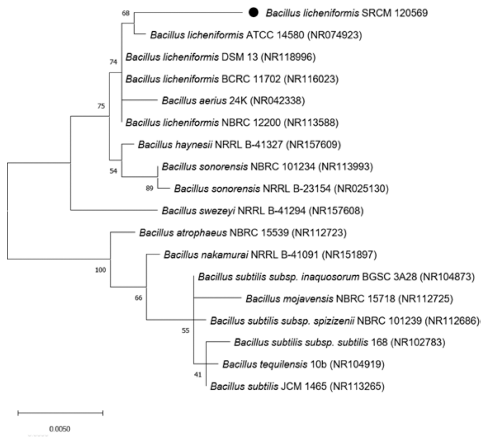
The partial 16S rRNA of SRCM 120569 strain sequencing analysis was performed commercially by Macrogen (Macrogen Inc., Seoul, South Korea) using the 27F (5’-AGAGTTTGATCMTGGCTCAG- 3’) and 1492R (5’-TACGGYACCTTGTTACGACTT- 3’) universal primers. Identification was carried out using the basic local alignment search tool (BLAST) in the NCBI website (http://blast.ncbi.nlm.nih.gov). And The partial 16S rRNA of the Bacillus licheniformis SRCM 120569 sequence data were deposited in the GenBank database. The maximum-likelihood (ML) tree constructed to confirm genetically distance with related taxa using MEGA 10.1.7 software with 1,000 bootstrap replications.
CR dye (C32H22N6Na2O6S2, CI Classification Number: 22120) was purchased from Sigma-Aldrich (St. Louis, Mo, USA). The CR dye was used without further purification. A stock solution of 10,000 mg CR/L was prepared using deionized water. The CR dye concentration was measured spectrophotometrically (Tecan Spark 10 M, Tecan Trading AG, Switzerland) at 505 nm (Bouras et al., 2017).
The B. licheniformis SRCM 120569 strain was characterized by several analytical methods including Fourier transform infrared spectroscopy (FT-IR) and point of zero charge (pHPZC) analysis. FT-IR analysis was carried out using a FT-IR spectrometer (Perkin–Elmer Spectrum 400, PerkinElmer, Inc., Shelton, CT) to confirm the functional groups of Bacillus licheniformis SRCM120569. The pHPZC of B. licheniformis SRCM120569 dried biomass was determined according to Brouers and Al-Musawi method (Brouers & Al-Musawi, 2015). The pHPZC was calculated by ΔpH (finial pH – initial pH) in 0.1 M NaCl solution.
To confirm the biosorption properties of the CR dye by the B. licheniformis SRCM 120569 cell pellets, dried B. licheniformis SRCM 120569 cell pellets were prepared by freeze-drying (-80°C, 5.0 Torr) for 48 h. The CR dye biosorption efficiency of B. licheniformis SRCM 120569 was determined for various initial pH levels (3.41-9.95), biomass dosage (0.01-0.09 g), and contact times (0-120 min). The initial pH values were titrated using 0.1 M HCl and 0.1 M NaOH. The biosorption capacity of the B. licheniformis SRCM 120569 was calculated from:
where qe (mg CR/ g dry cell biomass) is the biosorption capacity of the CR dye; V (L) is the reaction volume; C0 and Ct (mg CR/L) are initial and final CR dye concentration, and W (g) is the amount of the B. licheniformis SRCM 120569 biomass. All experiments were repeated three times.
The biosorption isotherms were analyzed using the Langmuir and Freundlich isotherm models (Non-linear form) with different initial CR dye concentrations (20.0-351.3 mg/L) to find the most suitable for the experimental data. B. licheniformis SRCM 120569 cells (0.03 g) were equilibrated in 50 mL of deionized water containing different initial CR dye concentrations (20.0-351.3 mg/L) for 2 h at 25°C while agitating at 150 rpm. The Langmuir and Freundlich isotherm model equations were expressed as follows (Freundlich, 1907;Langmuir, 1918):
where qe (mg CR/g dry cell biomass) is the biosorption capacity of the CR dye at equilibrium concentration; qmax (mg/ g) is the maximum biosorption capacity; KL and Kf (L/mg) is the Langmuir and Freundlich isotherm constant, respectively; Ce and C0 (mg/L) is the CR dye concentration at equilibrium and initial, and 1/n is an empirical parameter (adsorption intensity).
For kinetic modeling, pseudo-first-order and pseudosecond- order kinetic models were applied at different initial CR dye concentrations (157.2 and 330.4 mg/L). The kinetic experiments were carried out using 0.03 g of the B. licheniformis SRCM 120569 cells in 50 ml of deionized water for 120 min. The pseudo-first-order and pseudo-second-order kinetic model equations were expressed as follows:
where qt and qe (mg CR/g dry cell biomass) is the amount of loaded CR dye in the B. licheniformis SRCM 120569 biomass at time t (min) and equilibrium; k1 (1/min) and k2 (g/mg/min) are the kinetic rate constants of the non-linear pseudo-firstorder and pseudo-second-order kinetic models, respectively.
Results and Discussion
The 16S rRNA partial sequence of the SRCM 120569 was bootstrapped, and a phylogenetic tree was constructed using the BioEdit 7.0.5.3 and MEGA 10.1.7 software, respectively (Fig. 1). The phylogenetic tree, NCBI and EZBioCloud database indicate that SRCM 120569 is closely related to Bacillus licheniformis (Firmicutes; Bacilli; Bacillales; Bacillaceae; Bacillus, 99.65% identity) which was labeled as Bacillus licheniformis SRCM 120569 (GeneBank Accession No. MW819861).
The functional groups of the B. licheniformis SRCM 120569 are one of the important characterizations to understand the biosorption of the CR dye. Fourier transform infrared spectroscopy (FT-IR) analysis was performed in the range of 450-4,000 cm−1 to investigate the influence of the functional groups on the adsorption of the CR dye on the surface of the B. licheniformis SRCM 120569 (Fig. 2). The FT-IR spectra of dried cells shows the bands for the 3,279.6 cm−1 (-OH), 2,925.5 cm−1 (C-H), 1,640.3 cm−1 (amide C=O) and 1,530.4 cm−1 (secondary amines), 1,390.4 cm−1 (S=O), and 1,236.3 cm−1 (C-N), respectively (Fig. 2a).
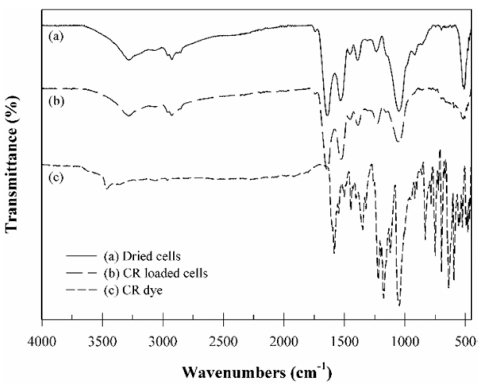
The CR dye loaded B. licheniformis SRCM 120569 showed bands shifting for the 3,281.8 cm−1 (-OH), 1,641.5 cm−1 (amide C=O), 1,526.9 cm−1 (secondary amines), 1,387.7 cm−1 (S=O), and 1,230.2 cm−1 (C-N), which indicate involved in the CR dye biosorption (Fig. 2b). The FT-IR result suggests that the functional groups in the surface of the bacteria are mainly involved in the biosorption of the CR dye. Similar FT-IR results were previously reported for the CR dye adsorption by the Ulva lactuca biomass and Self-Immobilized Mycelial Pellets (El-Naggar et al., 2020;Wu et al., 2020).
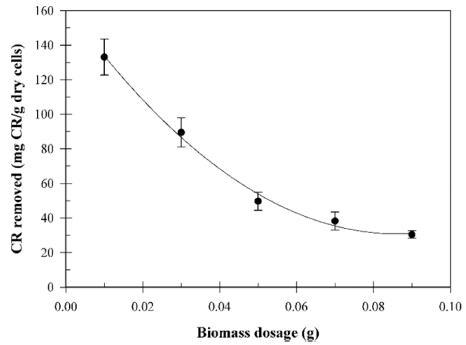
The influence of the biomass dosage on the biosorption of the CR dye from a solution containing 133.3 mg CR/L was investigated with a biomass dosage in the range of 0.01-0.09 g/ 50 mL shown in Fig. 3. The result showed that the maximum biosorption capacity is 133.1 mg/g at a 0.01 g biomass, and the biosorption capacity gradually decreased with an increasing biomass dosage due to partial cell aggregation. Previously, similar results were reported for the biosorption of a CR dye (Din et al., 2013). This result showed that the biosorption capacity dependent on the biomass dosage.
The biosorption of synthetic dyes in an aqueous solution is highly dependent on the solution pH and point of zero charge (pHpzc) of the absorbent due to the degree of ionization, surface charge, and dissociation of functional groups (Din et al., 2013;Kim et al., 2015). Fig. 4 shows the influence of the initial pH on the biosorption of the CR dye using the B. licheniformis SRCM 120569 biomass. The influence of the initial pH was determined at different initial pH levels (3.41-9.95). The maximum CR dye biosorption capacity was determined at pH 3.41 (61.2 mg/g). CR dye color can change from red to dark blue at a lower pH. Thus, the initial CR concentration was adjusted to pH0 at the lower pH (Din et al., 2013). The results suggest that the biosorption capacity of the CR dye gradually decreased with the increasing initial pH level, because of the competition between the excess OH- ions and anionic CR dye molecules at a higher pH level.
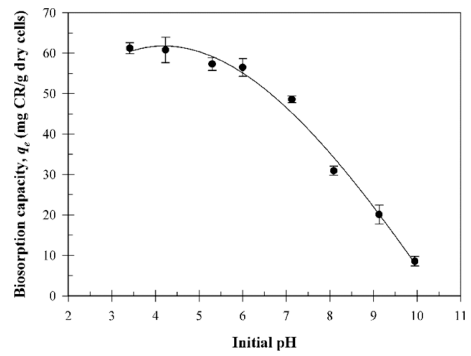
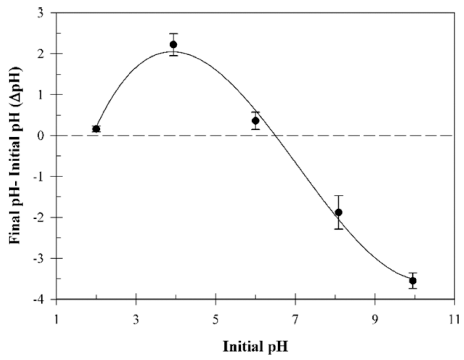
Fig. 5 shows the point of zero charge (pHpzc) of the B. licheniformis SRCM 120569. The pHpzc was determined at pH 6.5 (ΔpH = 0). B. licheniformis SRCM 120569 surface is positively charged below pH 6.5. Thus, higher anionic CR dye biosorption capacity showed at lower pH than pHpzc level.
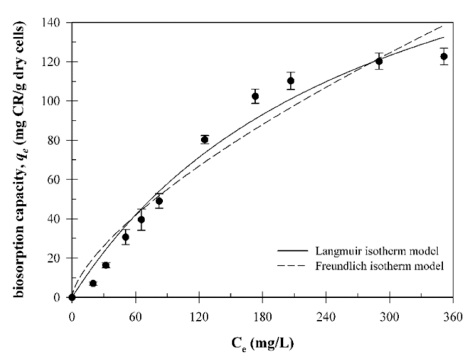
The Langmuir and Freundlich isotherm models were analyzed to understand the surface adsorption properties of B. licheniformis SRCM 120569. Equilibrium biosorption isotherm experiments were carried out at different initial CR dye concentrations (20-351.3 mg/L). The isotherm experimental data (qe and Ce) were plotted (non-linear form) in Fig. 6. The associated parameters for the isotherm models are given in Table 1. The coefficient of determination (R2) of the isotherm models indicates a better fit for the Langmuir isotherm model (R2 = 0.973) than for the Freundlich isotherm model (R2 = 0.945). These results suggest that the biosorption of CR dye is monolayer adsorption (Mokhtar et al., 2017). Additionally, dimensionless constant factor RL values (RL = 0.489) indicate that the CR dye biosorption process is favorable (0 < RL < 1).

|
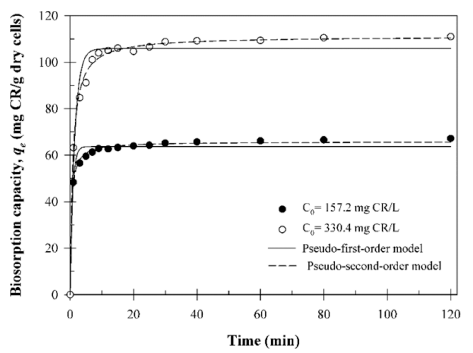
To obtain the biosorption kinetic data, 0.03 g of B. licheniformis SRCM 120569 biomass were equilibrated in 50 mL of deionized water containing different initial CR dye concentrations (157.2 and 330.4 mg/L). The equilibrium concentration of the CR dye was reached within 20 min. The pseudo-first-order and pseudo-second-order biosorption kinetic data were plotted in Fig. 7. Table 2 shows the biosorption kinetic parameters, respectively. According to the biosorption kinetic results, the pseudo-second-order kinetic model with high R2 values (0.997 and 0.996) indicated a better fit compared to the pseudo-first-order model. This result suggests that the biosorption of the CR dye on the B. licheniformis SRCM 120569 correspond to chemisorption or ion exchange (Vazquez et al., 2002). The qe values calculated using the pseudo-second-order model as 65.73 and 111.06 mg/g.

|
Conclusion
In the present study, the B. licheniformis SRCM 120569 strain was isolated from Korean turbid rice wine (Makgeolli). CR dye was effectively absorbed by the dried B. licheniformis SRCM 120569 biomass in aqueous solution. The maximum biosorption capacity of the B. licheniformis SRCM 120569 biomass was obtained with a pH of 3.14 and a biomass dosage of 0.01 g/50 mL. The pHpzc of the B. licheniformis SRCM 120569 biomass was determined at pH 6.5 (ΔpH = 0). The FTIR analysis result suggests that –OH, amide C=O, secondary amine, S=O, and C-N are involved in the CR dye biosorption. The initial pH, CR dye concentration, biomass dosage, and contact time highly affect the CR dye biosorption. Langmuir adsorption isotherm and pseudo-second-order kinetic models well fitted the biosorption experimental data. These results suggest that the B. licheniformis SRCM 120569 biomass might be a promising bio-absorbent for the removal of CR dye in an aqueous solution.


