Introduction
Direct surface application of antimicrobial substances onto food products, including dipping and dissolving of antimicrobials, exhibits limited antimicrobial effectiveness since the active substances are neutralized on contact or diffuse rapidly from the surface into the products. Antimicrobial incorporation in the food matrix has advantages over the direct surface applications because the food system can be designed to slow the diffusion of the antimicrobial agent (Min & Krochta, 2005). By slowing the diffusion to the food surface, the substance activity at the surface of food is maintained. Thus, smaller amount of antimicrobials is needed in the antimicrobial-incorporating food material to achieve a target shelf life as compared to the food material prepared with direct surface application of antimicrobials. The diffusion of the incorporated antimicrobials can be controlled by controlling food compositions (Han, 2000).
Nisin, a bacteriocin produced by Lactococcus lactis spp., can inhibit Gram-positive foodborne pathogens and spoilage microorganisms (Delves-Broughton et al., 1996; Park et al., 2009), including Brochothrix thermosphacta which is frequently involved in the spoilage of meat products stored aerobically or vacuum packaged at refrigerated conditions (Cayré et al., 2005; Kilcher et al., 2010). Nisin is applied as a preservative and an antimicrobial agent to a variety of foods, including meat, fish, dairy, beverage, and salad dressing products (Sobrino-López & Martín-Belloso, 2008; Ercolini et al., 2010; Abdollahzadeh et al., 2014; Gharsallaoui et al., 2016). Antimicrobial incorporation in food systems results in the preservation of foods by prolonging the lag phase of spoilage microorganisms (Sung et al., 2013). To extend the effect of antimicrobial application, antimicrobial has been embedded in polymer networks of food packages (e.g., films and coatings) to slow down its release to food systems. The application of the biodegradable polylactic acid (PLA) film containing nisin reduced the numbers of Listeria monocytogenes, Escherichia coli O157:H7, and Salmonella enteritidis in culture media and liquid foods by 2.5-4.5 log cycles (Jin & Zhang, 2008). The effectiveness of nisinincorporating edible films on food preservation was also reported previously (Sebti et al., 2004; Resa et al., 2014; Krivorotova et al., 2016). However, these experiments have studied the antimicrobial activity of nisin only in polymeric films. No previously-published research papers have reported the release characteristics of nisin in a gel food system and the release-dependent antimicrobial effects of nisin in the gel food system. Thus, the objectives of this study were to determine the diffusion profile of nisin in agar gels, model gel foods, with determination of the diffusion coefficient for the diffusion of nisin in the gels, and investigate antimicrobial effects of nisinincorporating agar gels at different concentrations of agar on the growth of B. thermosphaca in a microbial growth media.
Materials and Methods
B. thermosphacta was selected as the target microorganism to determine the antimicrobial activity of nisin released from the agar gel. All purpose Tween (APT, Difco, Becton Dickinson, Sparks, MD, USA) agar slants were used to maintain bacterial culture at 4 °C. B. thermosphacta (ATCC 11509) was cultured in brain heart infusion (BHI, Difco, Detroit, MI, USA) at 25 °C. Cells from 48 h-culture were collected by centrifugation (4,000×g, 15 min, 22 °C; GyroSpin, Gyrozen Co. Ltd., Seoul, Korea) and suspended in 0.1% (w/v) peptone water. The suspension (approximately 109 CFU/mL) was diluted with 0.1% peptone water for inoculation.
Nisin (Sigma-Aldrich Co., St. Louis, MO, USA) powder (1 g) was dissolved in 10 mL distilled water in a beaker with a stirring bar. The nisin solution was covered and agitated overnight to make nisin dissolve thoroughly. After 24 h, agar powder (A-1296, Sigma-Aldrich Co.) were dissolved in distilled water to prepare 1, 2, or 3% (w/v) agar solutions. Agar solutions were autoclaved at 121 °C for 15 min and left in a water bath at 50 °C. After equilibrium, the nisin solution was slowly transferred to the agar solution. The nisin-agar solution was left overnight at 24±2ºC in the dark to form agar gel model foods. The concentration of nisin in the gel was 2% (w/ v) and those of agar were varied at 1, 2 and 3% (w/v). The gel thickness was 1 cm.
The scheme of diffusion experiment is illustrated in Fig. 1. Agar gel model food was trimmed into cylinders of 1.0 cm diameter by 3.0 cm length using a sterile cheese borer. Each gel without edge damage was carefully transferred to a volumetric beaker, containing 100 mL distilled water. The beakers were covered with paraffin films and placed on a shaker (Julabo SW22, Labortechnik GmbH, Seelbach, Germany) rotating at 60 rpm at 24±2ºC. The absorbance was measured at 280 nm every 1 h using a spectrophotometer (Ultraspec 2000, Pharmacia Biotech, Piscataway, NJ, USA) (Breukink et al., 1998). The concentration of nisin released into water was calculated from a nisin standard curve. The release rate of nisin was determined with the ratio of the level of nisin released to the initial level of nisin in the agar.
The diffusion through the film was determined from the data obtained using the following solution for diffusion in a plane sheet, derived from Fick’s law (Crank, 1975). In this experiment, agar gel was assumed to be a homogeneous system containing nisin molecules uniformly in the gel matrix.
where,
-
Mt = mass of nisin released from the gel at time t;
-
M∞ = mass of nisin released from the gel at infinite time;
-
n = natural numbers;
-
D = diffusion coefficient;
-
L = half thickness of agar gel.
Eq. (1) can be simplified to Eq. (2) by a log transformation using only the first term in the summation series (Crank, 1975):
When only the experimental data over 40% of the maximum release were used, the following linear regression can be used:
where
Diffusion coefficient (D) can be determined as follows (Han et al., 2000):(4)
Experiment was conducted with the set-up illustrated in Fig. 1 using the B. thermosphacta-inoculated APT broth instead of distilled water. The inoculum of B. thermosphacta at 8 log CFU/mL (OD600 = 0.915) was transferred to 100 mL APT broth. Three experiments were conducted. First, the inhibitory effect of nisin in APT broth on the growth of B. thermosphacta in the broth was investigated. The concentrations of nisin in the broth were 0.1 and 0.5% (w/v). Secondly, the antimicrobial activities of the agar gel cylinders incorporating nisin (2%, w/ v) were evaluated in nisin free-APT broth. The concentrations of agar in the gels were 1, 2 and 3% (w/v). Lastly, the inhibitory effects of nisin released from agar gels with different concentrations of agar were studied in APT broth containing nisin at 0.1%. The cell density of the APT broth was measured at 600 nm. The measurement was made every hour with the samples in the shaker rotating at 60 rpm during incubation at 24±2ºC for 120 h.
Results and Discussion
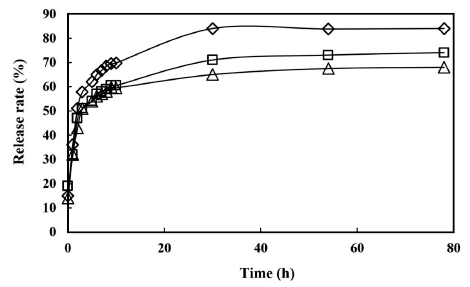
The highest release of nisin was shown in 1% agar gel, followed by 2% and 3%. The maximum release of nisin, demonstrated with 1% agar gel was 86%, while for 2% and 3% agar gels, the levels of release were 77% and 67%, respectively (Fig. 2). After about 30 h of release, nisin reached a steady state with its maximum release. At its steady-state, microorganisms could be continuously attacked by nisin which releases at maximum.

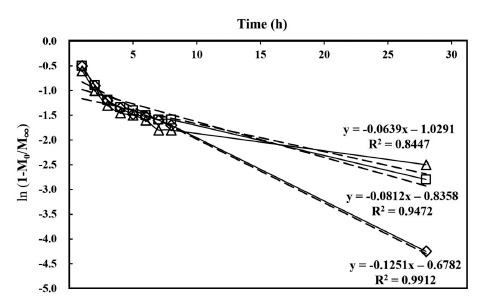
The experimental data which are over 40% of the maximum release rate were fit by the linear regression model of Eq. (3) (Fig. 3). Fig. 3 shows that the steady-state of the release has a very good fit to the linear model. The high linearity of ln (1- M0/M∞) to time (Fig. 3) indicates that this linear regression model is adequate to describe nisin release profile from the agar gels. The parameters of the regression models, determined from the release profiles of the gels of 1, 2 and 3% agar, are summarized in Table 1. The results in Table 1 and Fig. 3 demonstrate that the diffusion efficacy of nisin decreases with the increase of agar concentration in the gel. This might be due to formation of a gel network that could hold more nisin at a higher agar concentration. Hence, nisin release rate from agar gels can be controlled by adjusting the agar concentration.

The D values decreased as the agar concentration increased, agreeing with the release results described previously. The difference between the D values obtained from 1 and 2% agar gels (0.0044) was higher than the difference between the values obtained from 2 and 3% agar gels (0.0018). No experiments were conducted with agar at the concentration >3% since solidification of agar gels became difficult to control and gel cylinders were easy to break, which is consistent with the report by Sebti et al. (2004).
Ripoche et al. (2006) investigated nisin diffusion in agar gels at 10ºC for 6 days and reported the D values for the diffusion in the gels containing agar at 3.2, 3.9, and 6.7% as 4.2×10⁻⁷ , 3.4×10⁻⁷ , and 2.5×10⁻⁷ cm2 /s, respectively. The D for nisin diffusion in hydroxylpropyl methylcellulose polymer film at 25ºC ranged from 6.5×10⁻⁷ cm2 /s to 3.3×10⁻⁶ cm2 /s in a 3%- agar gel containing fat at 5 or 30% (w/w) (Chollet et al., 2009). In the current study, the D values were 1.2×10⁻² , 8.2×10⁻³ , and 6.4×10⁻³ cm2 /s with the gels containing agar at 1, 2 and 3%, respectively, and they are relatively high. The inconsistency of the D values might be due to various factors, including temperature, polymer morphologies including density, crystallinity, tortuosity, degree of crosslinking and branching, and glass transition temperature, and molecular interactions of the diffusants and host polymers (Bawa et al., 1985; Helmroth et al., 2002). The results suggest that the gel food system can be used as a nisin carrier for a controlled release of nisin, which is determined by the concentration of agar in the system.
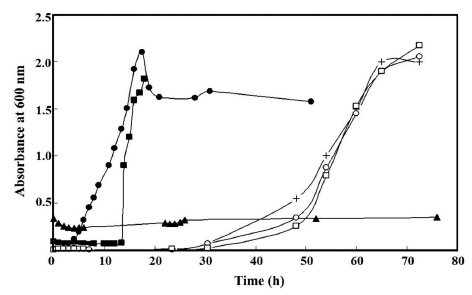
Addition of nisin at 0.1 and 0.5% in the APT broth retarded the growth of B. thermosphacta in the broth for about 9 and >72 h, respectively (Fig. 4). Treatment with the agar gels incorporating nisin also inhibited the growth of B. thermosphacta (Fig. 4). Without nisin in liquid broth solution, the release of nisin affected B. thermosphacta growth, prolonging the lag phase of B. thermosphacta growth by about 26 h (Fig. 4). These results suggest that nisin-incorporating agar gel is capable of inhibiting the growth of B. thermosphacta. A longer inhibition of the growth was observed with the gel containing agar at 1% than the gel with 3% agar. This could be due to a higher release of nisin from the gel at a lower concentration of agar in the gels as described previously.

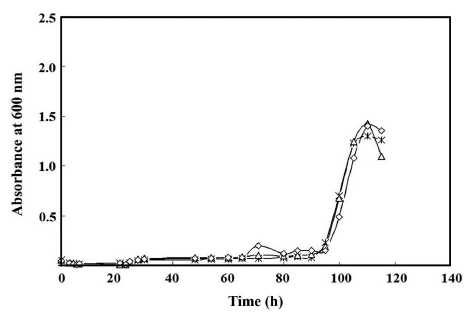
A simultaneous treatment of B. thermosphacta with the nisin (0.1%)-dissolved broth and the nisin-incorporating gel effectively inhibited the microbial growth in the medium, showing the initiation of logarithmic phase on about 95 h, irrespective of the concentration of the agar in the gels (Fig. 5). The effect of the concentration of agar in the gel formulation was not demonstrated in this result. This might be due to swelling of the gels induced by excessive storage of the gels in the liquid medium (115 h), which could destruct the nisin-hold gel networks at any concentration of agar. If the network were more resistant to moisture absorption, the microbial inhibition could be extended since potential uncontrolled outpouring of nisin into the broth, which can use up nisin immediately, could be prevented. The initiation point of the logarithmic phase of B. thermosphacta in the simultaneous treatment (90 h) was longer than the summation of the initiation points in the individual treatments of the nisin (0.1%)-dissolved broth (13 h) and the nisin-incorporating agar gel (30 h). The simultaneous treatment demonstrates its potential use as a means to control B. thermosphacta in liquid foods containing the gels as particulates.

Conclusion
The linear regression model is capable and convenient in determining the diffusivity of nisin in the gel systems with different agar concentrations. The D values for nisin decreased with agar concentration in the gels, suggesting the ability of the gel holding nisin increases with the concentration of agar. The growth of B. thermosphacta in the broth medium was effectively inhibited by placing the nisin-incorporating agar gel in the medium. The antimicrobial effect of the gel could be adjusted by controlling release of nisin by formulating the gel with different concentrations of agar. Furthermore, the addition of nisin the medium noticeably increased the microbial inhibition. The results presented in this study may be useful for designing gel or gel particulate-containing liquid products using nisin as a natural antimicrobial agent.


