Introduction
Surimi, which is made with Alaska pollack or Pacific whiting, is refined fish myofibrillar protein with cryoprotectants. This fish myofibrillar protein undergoes conformational change like a three dimensional network formation by heatinduced gelation (Lanier, 2005). The optimum range of salt, protein and water contents, ionic strength, and temperature are the factors affected the gelation process.
The pH is one of the most important factors affecting protein solubility, conformational change, thermal denaturation, and rheological properties of fish muscle protein, which in return affects the gelation properties of fish myofibrillar proteins (Tadpitchayangkoon et al., 2010). Surimi has a neutral pH, and increasing pH beyond the isoelectric pH (PI) increases the net negative charge, affecting the conformational state (unfolding) due to electrostatic repulsion and increase solubility (Biswas & Siddhartha 1995).
Partial solubilization of myofibrillar proteins also can be achieved using proper salt concentration (Cando et al., 2015) to induce protein unfolding, which makes salt an important part of surimi formulations. Solubilized myofibrillar proteins subsequently form a three dimensional gel network upon thermal processing (Manley et al., 2005).
Gel strength is a major factor in determining quality and functional properties of fish protein gel. Esturk et al. (2006) demonstrated that there was a significant linear relationship between surimi gel strength and dynamic rheological analysis, based on varied moisture contents. Further studies, considering various factors involved in processing nature, however, are needed to find feasible methods to predict the gel quality through non-failure test.
Our objectives were to investigate the effects of pH and salt concentration on both failure and non-failure rheological properties of Pacific whiting surimi, and to determine whether these processing parameters can be used as a guide for estimating final product quality.
Materials and Methods
Frozen Pacific whiting surimi containing 4% sugar, 4% sorbitol, and 0.3% sodium phosphate were obtained from Pacific Surimi (Warrenton, OR, USA). Each sample (1 kg/ block) was vacuum-packed and stored at -30 ° C until used.
Surimi gel preparation and testing were done as described by Lee et al. (2017). Moisture content was adjusted to 78%, and samples were prepared at various pH (6.0-7.5) and salt concentrations (0-3%, w/w). A small portion (100 g) was saved for dynamic rheological testing, while the remaining was cooked in stainless steel tubes (ID=1.87 cm, length= 17.75 cm) at 90 ° C for 30 min.
The pH was measured using a pH meter (Model HI 9025C, Hillsboro, OR, USA). After the target pH was achieved using 1 N HCl or 1 N NaOH during mixing, the paste was chopped until reaching a final temperature of 5 ° C.
Dynamic tests were conducted by the method of Esturk et al. (2006) using a cone and plate (CP 4/40, 4 o angle, 40 mm dia) Bohlin CS-50 Rheometer (Bohlin Instruments Inc., East Brunswick, NJ. USA). The linear viscoelastic range was determined by stress sweep ranged 0.5-1,500 Pa. Storage modulus (G’) was obtained from 10 to 80 ° C at a 1 ° C/min of heating rate with 0.1 Hz frequency.
Torsion test for failure gel analysis was performed using a Hamann Torsion Gelometer (Gel Consultants, Raleigh, NC, USA). Failure shear stress and failure shear strain of the surimi gel were determined based on the torque and the angular twist displacement (Hamann, 1983).
Thermal property of whiting surimi was studied in a DSC Ⅲ (Setaram, Lyon, France). Sample (500 mg) was weighed in a vessel, and water was used as the reference. The scanning temperature was 20-90 ° C at a heating rate of 1 ° C/min.
A Minolta Chroma Meter (CR-300 Ramsey, NJ, USA) was used, and L * , a * , and b * values were obtained to measure the lightness, red-green, and yellow-blue hue of surimi gel.
Results and Discussion
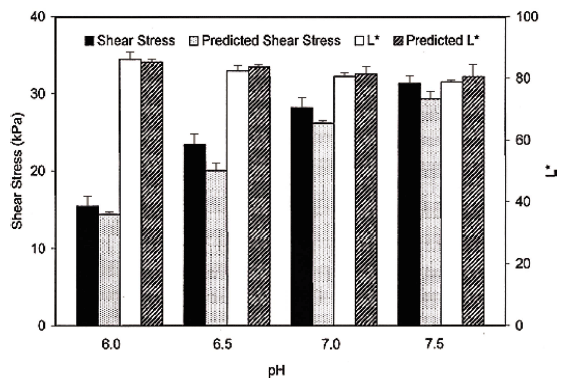
The effect of pH on failure shear stress and strain was significant (p<0.05). Failure shear stress of Pacific whiting surimi gels increased linearly as pH increased within the experimental range (pH 6.0-7.5) (Fig. 1). Failure shear stress was 15.40, 23.45, 28.19, and 31.32 kPa for pH 6.0, 6.5, 7.0, and 7.5, respectively. As the pH increased beyond the isoelectric pH, the net charge increased negatively, resulting in increased solubility, providing more binding sites and increasing gel strength (Damodaran, 1996). Failure shear strain values increased up to pH 7.0. At pH 7.5, failure shear strain decreased slightly, but remained insignificant (p>0.05) (Fig. 1). But, the linearity of shear strain as a function of pH was not high enough.
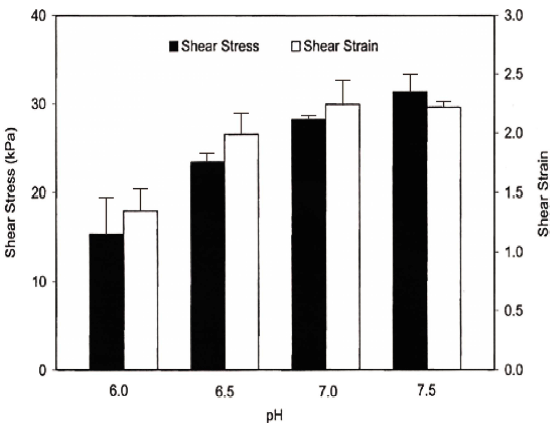
Chung et al. (1993) reported that shear stress and strain of Pacific whiting surimi gel increased steadily when the pH increased from 5 to 10. Lee et al. (2016) reported, however, Alaska pollock surimi gel showed the lowest level of gel strength at pH 10, and the highest breaking force at pH 7.5. Also, the low solubility at pH 10 showed a low water holding capacity (Romero et al., 2011) and a collapsed gel formed (Ni et al., 2014). There was a dramatic decrease in gel strength of Alaska pollock surimi when the pH was lowered from 6.75 to 3.77 (Nishino et al., 1991), and lower pH had a strong effect on the proteolytic activity, resulting in reduced gel strength (Morrissey et al., 1995).
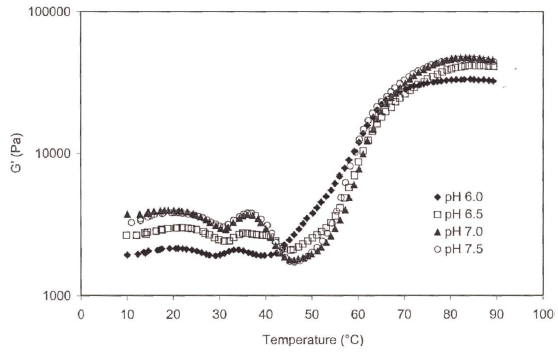
The profiles of the storage modulus during heating are shown in Fig. 2. At the beginning of the temperature sweep, the highest storage modulus (G') values were observed at pH 7 or 7.5, while the lowest value was observed at pH 6.0 up to 41 ° C. Esturk et al. (2006) suggested that decreases in G' around 30 and 45 ° C probably related to protein unfolding. However, at temperatures above 50 ° C, G' of all surimi paste increased rapidly and showed the same pattern. When the pH of protein gets closer to the isoelectric pH 5.5 (Kinsella, 1984), the net charge of a protein molecule decreases and in return protein-protein interactions increase (Damodaran 1996) and this makes protein stability increases. This could be the reason for the different patterns of G' at pH 6.0 since it is closer to the pI (pH 5.5).
There was a significant effect of pH on the lightness (L * ) of surimi gel sample (p<0.05). Lightness decreased from 86.22 to 78.86 as pH increased from 6.0 to 7.5 (Fig. 6). The increased lightness and reduced shear stress of surimi gels at lower pH may have resulted from a coagulum type of aggregation, which yields more opaque and brittle gels (Wicker et al., 1986).
The failure shear stress and shear strain in surimi gel are shown in Fig. 3. The lowest failure shear stress and failure shear strain values are obtained without salt during comminuting. As a salt concentration increased up to 1.0%, the failure shear stress value increased but decreased above 2% salt. The decreased in failure shear stress and shear strain at higher salt concentrations was probably due to salting-out effect, resulting in some protein aggregation. Failure shear strain followed a similar trend to failure shear stress.
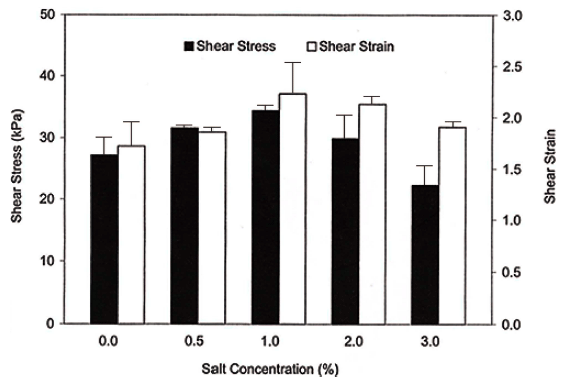
The main function of salt is to help solubilize the myofibrillar protein, thus improving gel formation (Cando et al., 2020). Usually gel made with a lower salt concentration tends to be a lower gel strength, and normally 2-3% salt concentration is used in industry (Park, 2005). Because partial solubilization of myofibrillar proteins is necessary to obtain the desired functional property, proper salt addition is necessary. However, as shown in Fig. 3, it might be depend on fish species. Park and Lin (2005) reported that Alaska pollock gels prepared with 0.5% salt had the lowest shear stress and strain values, and the highest gel strength was obtained with gels containing 2.5% salt.
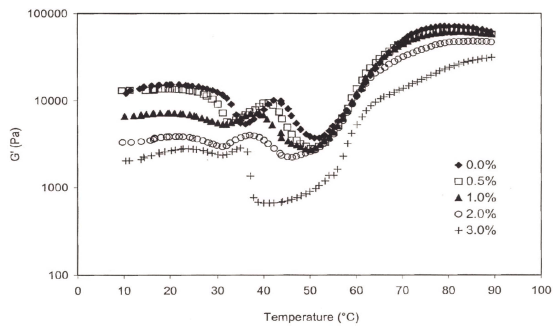
As salt concentration increased, the G' consistently decreased at all temperatures (Fig. 4). Fish proteins prepared with 3% salt, in particular, had a significantly lower G' value at all temperatures and showed the biggest depth at 40 ° C. Esturk et al., (2006) showed a linear relationship between the G' and failure shear stress values. However, samples with various salt concentrations did not follow this trend.
There were 4 endothermic peaks clearly distinguishable at low salt concentrations (0 and 0.5%). However, the peaks observed around 35 and 40 ° C were less noticeable and shifted to the lower temperatures at increased salt concentrations (2.0 or 3.0%) (Table 1, Fig. 5). Observed peak transition temperatures for the first peak, referring to the denaturation of myosin (Tahergorabi & jaczynski, 2012), at 0, 0.5, and 1.0% salt concentrations were 35.4, 33.5 and 32.2 ° C from DSC and 35.8, 33.2, and 31.9 ° C from dynamic rheology measurements (temperatures sweep), respectively (Table 1). The 4 th peak at 68.8 ° C attributed to actin transition temperatures. Angsupanich et al., (1999) reported four endothermic transition temperatures at 34.2 o , 43.8 o , 50.6 o , and 60.9 ° C and at 33.5 o , 44.5 o , 51 o and 74.7 ° C for cod and blue whiting, respectively.
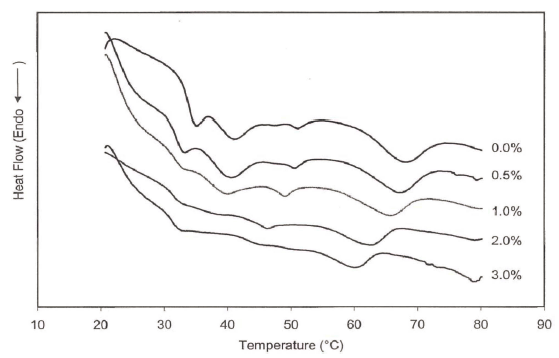
Dynamic and DSC data indicated that an increase in salt concentration shifted the transition temperatures to lower values (Figs. 4, 5). Salt concentration also decreased the transition enthalpies of heat (△H). They were 0.3078, 0.2711, 0.2505, 0.1959, and 0.1411 J/g for 0.0, 0.5, 1.0, 2.0, and 3.0% salt concentrations, respectively, indicating that salt additions shifted protein transition to lower temperature and is likely to be indicative of its lower stability (Tahergorabi & Jaczynski, 2012).
Best fitting models between failure shear stress and temperature sweep data point within the range of 20-45 ° C were determined using multiple linear regression as described by Esturk et al. (2006). The equations developed for temperature sweep data at 25 ° C is:
Failure Shear Stress = -29.5729 + 6.2893 pH + 0.0063G' (R 2 =0.93)
where, pH is the pH of the sample, G' is the storage modulus at 25 ° C. The relationship between failure shear stress and pH was significant when a 95% confidence level was used.
As for model verification, experimental and prediction values of new surimi batches were compared using the equations developed using G' values at 25 ° C. At pH 7.0, predicted shear stress and L * values were 29.04 kPa and 81.39 (Fig. 6) using above regression model, respectively. The corresponding failure shear stress and L * values from the experiment were 28.19 kPa and 80.54, respectively.
However, the correlation between failure shear strain and dynamic data was low. It was noted that the relationship between the dynamic rheological measurements at the sol state and the failure measurements at the gel state could be used to predict surimi gel strength (shear stress) and L * (lightness).
Conclusion
A linear relationship was found between failure shear stress and dynamic test data as a function of pH, and this relationship was used for the prediction of surimi gel strength. However, a similar relationship was not observed when salt concentration was used as a variable. Peak temperatures obtained from the temperature sweep test were very closed to those obtained from DSC, indicating that peaks obtained from the dynamic tests were related to protein unfolding.