Introduction
Rice is a staple food in the world and is consumed principally as a whole grain. The texture and digestibility of the whole grain are matters of primary importance (Ong & Blanshard, 1995). Different waxy and non-waxy rice cultivars are known to be digested at different rates (Lumdubwong & Seib, 2000). These differences have been attributed to numerous factors including amylose content. Due to the linear structure of amylose, amylose-rich starch granules are thought to have more extensive hydrogen bonding and hence more structural crystallinity than lower amylose starch granules. Consequently, high-amylose rice cultivars swell or gelatinize less readily upon cooking, are digested more slowly, and result in lower blood glucose and insulin responses than lowamylose cultivars (Panlasigui et al., 1991). However, when starch granules are gelatinized, their molecular order is destroyed, and they are digested easily (Holm et al., 1988).
In addition, amylose content affects the textural and rheological properties of starch. The initial stage of starch gelation is dominated by the gelation of solubilized amylose (Miles et al., 1985), implying that the solubilized amylose plays the key role in this process. In a previous study, several factors were examined for their effects on gelatinization, starch gel formation, and rheological properties of rice starch: the starch variety, starch concentration, and inherent and added amylose contents (Lii et al., 1995). However, research on the effects of flour concentration on in vitro starch digestibility is still limited.
Moreover, most starchy foods are cooked before consumption. Gelatinization significantly increases the susceptibility of starch to digestive enzyme because of the breakage and dissolution of the tight crystalline granular structure (Holm et al., 1988;la Rosa-Millan et al., 2015). Native starch is digested slowly by enzymes during in vitro starch digestion, because native starch granules have a high degree of molecular order and are associated by hydrogen bonds. Glucose and insulin responses have been reported to be significantly greater after gelatinized starch intake than native starch intake in vivo study (Anyakudo, 2014). Thus, the degree of gelatinization greatly affects the rate of starch hydrolysis and the metabolic response. Although the impact of gelatinization on starch hydrolysis has been evaluated, the effect of degree of gelatinization on in vitro starch digestibility of Goami rice cultivars has not been thoroughly investigated. Information regarding the in vitro digestibility of native, partially gelatinized, and fully gelatinized starches is meaningful to the food industry, especially, for those divisions that use Goami rice cultivars.
Thus, in this study, the in vitro starch digestibility and gel strength of three rice cultivars with different amylose contents were evaluated at different concentrations (10-30%) in gelatinized rice gels. The three rice cultivars were Segoami (high-amylose rice cultivar), Seilmi (non-waxy rice cultivar), and Baegokchal (waxy, low-amylose rice cultivar). Moreover, the effects of degree of gelatinization (native → partial → full) on in vitro starch digestibility, structural characteristics, and rheological properties of the newly developed functional rice cultivar ‘Segoami’ were also investigated.
Materials and Methods
Brown rice cultivars (Segoami, Seilmi, and Baegokchal) produced in 2014 were obtained from the National Institute of Crop Science (NICS), Rural Development Administration (RDA), Mirayang, Korea. The rice was ground, passed through a 100-mesh sieve, and stored at 4°C until further use. The amylose contents of the rice flours, as determined by an iodine reagent method (Juliano et al., 1981), were as follows: Segoami (27.9%), Seilmi (17.9%), and Baegokchal (5.2%). Salivary amylase (A0521), pancreatin from porcine pancreas (P7545, activity 8 × USP/g), bile extract (B8631), and amyloglucosidase (A9913) were obtained from Sigma-Aldrich (St. Louis, MO, USA). A total starch assay kit (K-TSTA) and glucose oxidase-peroxidase assay kit (GOPOD, K-GLUC) were purchased from Megazyme International Ireland Ltd. (Bray, Ireland).
All rice flour was suspended in distilled water (total concentration: 10-30%, w/w), heated in a boiling-water bath for 5 min, and steamed for 40 min in a stainless steel steam pan for full gelatinization.
In vitro starch digestion was conducted with the methods described by Minekus et al. (2014) and included the procedures of oral, gastric, and intestinal digestion. For oral digestion, the sample (5 g) was mixed with simulated salivary fluid (SSF, 3.5 mL) electrolyte stock solution, followed by 0.3 M CaCl2 (25 μL), water (975 μL), and salivary α-amylase solution (0.5 mL), and thoroughly mixed. The mixture was then incubated for 2 min at 37°C in a shaking water bath while being stirred at 100 rpm. After this step, gastric digestion was performed. The oral bolus was mixed with simulated gastric fluid (SGF, 7.5 mL) electrolyte stock solution, 0.3 M CaCl2 (5 μL), water (0.695 μL), and porcine pepsin stock solution (1.6 mL). Then, 1 M HCl was added to adjust the pH to 3.0 and the mixture was incubated for 2 h. For intestinal digestion, gastric chyme was mixed with simulated intestinal fluid (SIF, 11 mL) electrolyte stock solution, 0.3 M CaCl2 (40 μL), 1 M NaOH (0.15 mL), pancreatin-bile solution (7.5 mL), and amyloglucosidase (0.2 mL per gram of starch in the sample). The pH was adjusted to 6.0 with 1 M HCl. Aliquots (0.1 mL) were collected at different times (30, 60, 90, 120, and 180 min) during digestion and mixed with ethanol (1.4 mL). These solutions were centrifuged (600 × g for 5 min), and the released glucose contents of the supernatants were measured with the GOPOD kit at 510 nm. The levels of rapidly digestible starch and slowly digestible starch were measured after intestinal digestion for 30 min and 120 min, respectively, and resistant starch was measured as the starch remaining after 180 min of incubation.
The digestion kinetics and pGI were determined according to the procedure established by Goñi et al. (1997). The kinetics of starch hydrolysis were calculated with the equation: (C = C∞(1 − e-kt)), where C, C∞, and k denote the hydrolysis degree at each time, the maximum hydrolysis extent, and the kinetic constant, respectively. The hydrolysis index (HI) was calculated as the area under the hydrolysis curve of each sample divided by the corresponding area of a reference sample (fresh white bread). The pGI was calculated with the equation: pGI = 39.71 + 0.549HI.
A puncture test was conducted with aa TA-XT2i Texture Analyzer (TA-XT2i, Stable Micro System, Haslemere, UK) at a test speed of 1 mm/s using a 5 mm-diameter probe. The maximum depth of penetration was kept constant at 7 mm, and five samples tested each time. The gel strength of each sample was obtained from the maximum force value and the corresponding displacement (Kapri & Bhattacharya, 2008).
The pasting curve of the rice flour was analyzed to confirm the degree of gelatinization. Segoami was selected because it had the highest pasting temperature and amylose content, and rice flour gels were prepared under various conditions. First, rice flour was dispersed at a concentration of 10% (w/w) in distilled water. For preparation of the partially gelatinized sample, the flour dispersion was boiled for 20 min while being mechanically stirred. For preparation of the fully gelatinized sample, the flour dispersion was boiled for 5 min then steamed for 40 min in a stainless steel steam pan. The rice flour gels were lyophilized and used in a controlled-stress rheometer (AR1500ex; TA Instruments, New Castle, DE, USA) equipped with a starch pasting cell. A 10.71% rice flour suspension was subjected to a programmed heating-cooling cycle in which the temperature was held at 50°C for 1 min, raised to 90°C at a rate of 12 °C/min, held for 2 min, cooled to 50°C at a rate of 12 °C/min, and held for 2 min.
The structural changes during in vitro digestion according to gelatinization degree (native, partial, and full gelatinization) were analyzed according to the methods of Lee & Moon (2015). Digestion was stopped by the addition of 99.8% ethanol at 0, 30 and 180 min after intestinal digestion, and the hydrolyzed solution was isolated by centrifugation (3,000 × g, 20 min). The air-dried residue samples were used for XRD analysis. X-ray diffractograms were obtained with an X-ray diffractometer (SmartLab, Rigaku Co., Tokyo, Japan). The diffractometer was operated at 40 kV and 20 mA with a measurement angle (2θ) of 1.5-40° and a scan speed of 8.0°/min.
Scanning electron microscopy (SEM) images were performed by a scanning electron microscope (Nova NanoSEM 450, FEI Corp., OR, USA). Hydrolyzed samples were placed on the aluminum stub and fixed with double-sided adhesive carbon tape. Finally, the samples were coated with platinum. SEM images were taken at an accelerating voltage of 5 kV. Representative micrographs were taken for each sample at a magnifications of 5,000×.
Hydrolyzed samples (10 mg) were added to 10 mL of deionized water and boiled with stirring for 30 min to completely dissolve the samples. The dissolved samples were filtered thorough 5 μm-nylon membrane and then injected into an Agilent 1100 Series HPLC system (Agilent 1100 series, Agilent Technologies, Palo Alto, CA, USA) equipped with Shodex OHpak SB-804 and SB-802.5 columns (Showa Denko, Tokyo, Japan) for molecular-weight determination (Wang et al., 2011). The column temperature was maintained at 55°C, while the temperature of the RI detector was set at 30°C. Elution was performed with HPLC grade water at a flow rate of 1.0 mL/min. P-5, P-10, P-20, P-100, P-200 P-400, and P- 800 (Shodex Standards, Kawasaki, Japan) were used as standard curve reference substances.
Immediately after 30 or 180 min of digestion, the apparent viscosity of the hydrolyzed Segoami was measured in a rheometer (RheoStress RS1, Thermo Haake, Karlsruhe, Germany) with parallel plate geometry (35-mm diameter and 1-mm gap). Hydrolyzed solutions were loaded between parallel plates in the rheometer. Afterward, the samples were covered with a thin layer of silicon oil to prevent moisture loss. The apparent viscosities of the hydrolyzed solutions were measured as a function of shear rate over a range of 0.1-100 s-1 at 25°C.
Results and Discussion
The effects of amylose content on the starch digestibility and gel strength of rice flour are presented in Table 1 in terms of pGI and max force values of gelatinized rice at various concentrations (10-30%, w/w). The pGI values of the rice gels decreased as amylose content and rice flour concentration increased. The gel consistency increased with increasing starch concentration, and hydrolysis decreased as gel consistency increased (Lamsal et al., 2007) Therefore, the gel consistency inversely affected in vitro starch digestibility. When the gel strengths of rice gels at the same concentration were com pared, Segoami displayed the highest strength at all tested concentrations above 15%, followed by Seilmi and Baegokchal (p<0.05).
The relationships of rice flour concentrations with in vitro starch digestibility and gel strength are presented in Fig. 1. Rice flour concentration correlated negatively with pGI and positively with gel strength. The pGI values of the three rice cultivars (Segoami, Seilmi, and Baegokchal) decreased similarly as concentration increased, regardless of amylose content.

On the other hand, Segoami displayed the highest gels strengths, followed by Seilmi and Baegokchal. The gel strength increased significantly in proportion to the amylose content, possibly because the amylose content influences the water mobility of starch gels. It is known that the extent of the amylose gel network and the deformability of the swollen granules are the main factors contributing to gel strength (Luyten et al., 1992). These results suggest that the less mobile state was associated with granular remnants, and that the enhanced hardness of the starches can be attributed to greater granule swelling. Granular structure and composition were reported to be major factors affecting the rheological properties of rice starch pastes and gels (Lii et al., 1995). In addition, waxy rice starch with only a negligible amount of amylose cannot develop a gel matrix. Thus, in case of low concentration of non-waxy rice starch or waxy rice starch, the structure of swollen starch granules were completely ruptured (Lu et al., 2011).
Another objective of this study was to develop a fast screening tool based on equations for determining pGI and gel strength, which would be preferable for laborious and expensive starch determination techniques. The relationships between rice flour concentration and pGI values of Segoami, Seilmi, and Baegokchal are shown in Fig. 1(A) and can be described by the following regression equations: pGI = -0.4887 × (Rice flour concentration) + 88.857 (for Segoami; R2 = 0.86); -0.4649 × (Rice flour concentration) + 90.517 (for Seilmi; R2 = 0.94); and -0.5036 × (Rice flour concentration) + 90.770 (for Baegokchal; R2 = 0.92). The three rice cultivars had similar slopes. Thus, the pGI value decreased with increasing of the rice flour concentration regardless of amylose content.
The relationships between rice flour concentration and gel strength of Segoami, Seilmi, and Baegokchal are shown in Fig. 1(B) and can be described by the following regression equations: Gel strength = 16.237 × (Rice flour concentration) – 205.97 (for Segoami); 7.9209 × (Rice flour concentration) – 91.657 (for Seilmi); and 1.5856 × (Rice flour concentration) – 18.347 (for Baegokchal). When the rice samples were considered individually, stronger relationships were observed, with R2 values ranging from 0.85 to 0.96. The slopes of the gel strengths increased significantly in proportion to rice flour concentration and amylose content. These findings are supported by a previous study, in which the gel textural properties correlated significantly with amylose content (Vandeputte et al., 2003). Thus, amylose content highly correlates with the physical properties of starch gels.
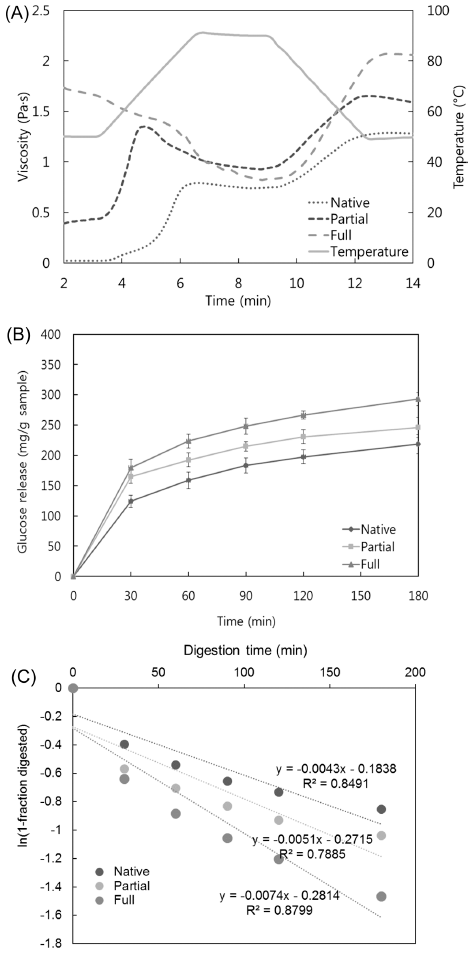
The pasting viscosity was utilized to confirm the degree of gelatinization of starch granules and the extent of their molecular breakdown (Hagenimana et al., 2006). As shown in Fig. 2(A), a freeze-dried gel powder that was heated for 20 min in boiling water had a higher initial viscosity than native rice flour. A small peak was observed in pasting curve, suggesting that a partial starch gelatinization took place. On the other hand, freeze-dried gel powder steamed for 40 min had the highest initial viscosity, and no characteristic peak was detected. It indicated that the gelatinization process destroyed and melted the starch particles, becoming α-starch. The degree of gelatinization was confirmed by analyzing the pasting curve pattern.

Glucose release curves for Segoami (native, partial, and full gelatinization) are shown in Fig. 2(B). Glucose release was measured as the reducing sugars degraded from starch by digestive enzymes. Overall, starch hydrolysis sharply increased up to 30 min and then gradually increased until 180 min. The amount of released glucose increased with increasing degree of gelatinization. Native flour was the least hydrolyzed, while partially gelatinized flour was hydrolyzed at a rate between those of fully gelatinized and native rice flour, indicating that the hydrolysis rate increased proportionally with the degree of gelatinization.
The pGI values also increased with increasing degree of gelatinization. The pGI values of partially and fully gelatinized flour were 79.96 and 85.94, respectively. On the other hand, the pGI value of native flour was 73.61, indicating that gelatinization increased the pGI of partial and full gelatinized Segoami rice by about 9% and 17%, respectively. This indicated that the degree of gelatinization significantly influenced the digestion and absorption rates of Segoami (p<0.05).
As shown in Fig. 2(C), the digestion rate coefficient indicated that fully gelatinized Segoami was hydrolyzed more rapidly than Segoami with native or partially gelatinized Segoami. The degree of gelatinization correlated positively with in vitro starch digestibility. Fully gelatinized Segoami exhibited a stronger correlation than native or partially gelatinized Segoami, with an R2 > 0.90. Structural disruption of native flour by gelatinization increases its susceptibility to enzymatic degradation in vitro and thus increases its availability for digestion and absorption (Granfeldt et al., 2000). Gelatinization alters the interactions between starch chains by disrupting inter- and intra-molecular hydrogen bonds. This weakens the granular structure of the starch, leading to swelling and disintegration. Thus, the availability of starch chains to digestive enzymes increases as gelatinization progresses. During full gelatinization, most of the swollen starch granules are completely disrupted by excess heat and water, so the starch is transformed to a continuous amorphous structure, whereas partial gelatinization might not completely disrupt the swollen starch granules. Therefore, fully gelatinized starch molecules are more physically accessible to digestive enzymes than partially gelatinized starch molecules (Chung et al., 2006).
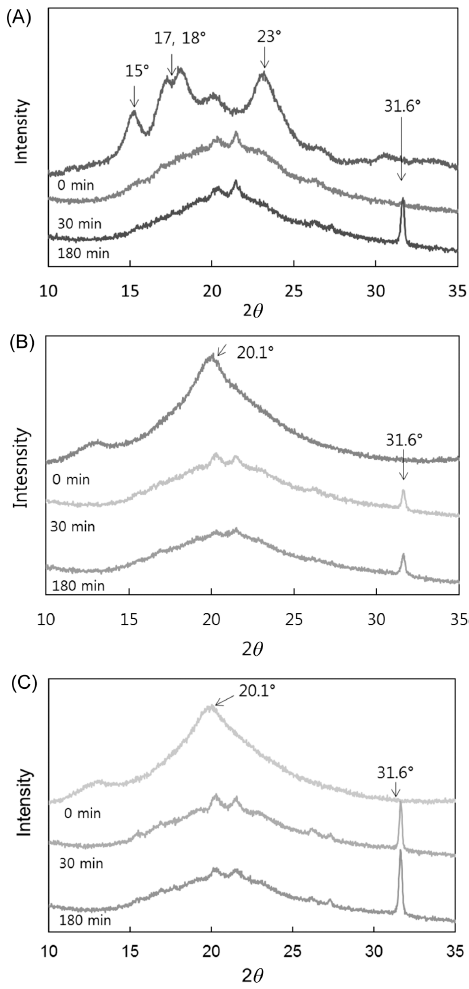
X-ray diffraction (XRD) of starch granules in native flour generated a typical A-type pattern, with major reflections at 2θ = 15 and 23°, and an unresolved doublet at 17 and 18° (Fig. 3A). Differences in XRD patterns according to degree of gelatinization are presented in Fig. 3(B) and 3(C). Native flour lost most of its crystalline peaks after gelatinization, except for two peaks at 2θ = 13.4 and 20.1°. Analogous results were obtained for partially and fully gelatinized flour, in that most peaks disappeared, except for two peaks at 2θ = 13.4° and 20.1°. This indicates that the structure of Segoami was almost completely destroyed, which contributed to the new peaks of V-type crystallinity. This is consistent with a previous report indicating that starch granules lost birefringence after being heated (Xie et al., 2006).

Native flour lost most of its crystalline peaks during in vitro starch digestion, and the V-type structure remained during the in vitro starch digestion process, but changes in the intensity of the diffraction peaks reflected changes in the structure (Yoon & Lee, 1998). As in vitro starch digestion progressed, the peak at 20.1° decreased in intensity until it disappeared, and the other V-type reflections shifted toward lower 2θ degrees, demonstrating a change from the dehydrated to the hydrated V form (Zobel, 1988). The peak at 31.6° increased in intensity as in vitro starch digestion progressed. Similar results were reported in a previous study (Lopez-Rubio et al., 2008). For native Segoami flour, the peak at 31.6° appeared after 180 min of digestion, as can be seen in Fig. 3(A). In contrast, the peak at 31.6° appeared after 30 min of digestion for partially and fully gelatinized samples (Figs. 3B and C).
The changes in molecular weight (Mw) of Segoami (native, partially, and fully gelatinized) during in vitro starch digestion are presented in Table 2. The molecular distributions of three fractions (Fraction 1 elution time = 10-20 min, Fraction 2 elution time = 20-30 min, and Fraction 3 elution time = 30-40 min) were detected in the elution profile. The molecular weights of the first, second, and third fractions in the profile ranged more than 7.08 × 10⁵ , between 3.44 × 10⁵ and 9.6 × 10³ , and less than 5.9 × 10³ . As the degree of gelatinization increased, the proportion of Fraction 1 decreased, corresponding to the macromolecules. Starch molecules can be degraded during gelatinization if the starch is overheated (Bello-Perez et al., 1998). The Mw distributions of the gelatinized starches were changed by the digestive enzymes. Native flour maintained the same proportion of Fraction 2 during in vitro starch digestion, but the proportion of Fraction 2 in the gelatinized Segoami flour decreased as in vitro starch digestion progressed. The proportion of Fraction 3 rapidly increased after in vitro starch digestion along with degree of gelatinization.
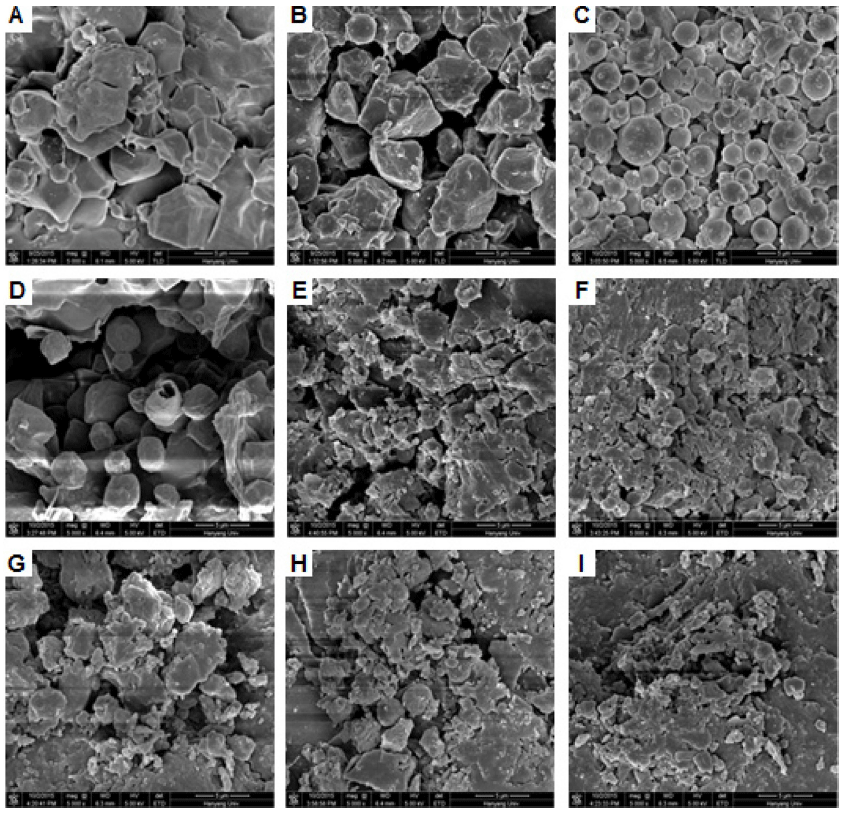
Scanning electron micrographs of starch residues hydrolyzed by digestive enzymes are presented in Fig. 4. As determined previously (Man et al., 2013), native granules were polygonal, with sharp angles and edges, and no pores were observed on their surfaces (Fig. 4A). As gelatinization progressed, the starch granules were broken up into subgranules. The granule size was particularly reduced upon full gelatinization, and stratified and layered structures could be seen (Fig. 4G). At an early stage of hydrolysis (30 min), the native flour was smoother than it was before in vitro starch digestion (Fig. 4B). Partially and fully gelatinized samples were smaller than early stage of hydrolysis (30 min) (Fig. 4E and H). After 180 min of hydrolysis, the native granules were spherical or oval. Partially and fully gelatinized starches were split open, and cracked starch granules were clearly visible (Figs. 4F and I). The fully gelatinized starch was almost destroyed.

In a previous study, smaller granules were reported to be more susceptible to enzymatic hydrolysis than larger granules. The lower susceptibility of large starch granules to enzymatic hydrolysis has been attributed to their smaller granule specific surface area, which can reduce the extent of enzyme binding and hydrolysis (Tester et al., 2006). The enzyme must interact directly with its substrate, and this process will be greatly influenced by the structure of the starch granule (Slaughter et al., 2001). The destroyed structures demonstrated that the rice flour granules had gradually become subgranules due to the heavy structural degradation by enzymatic hydrolysis.
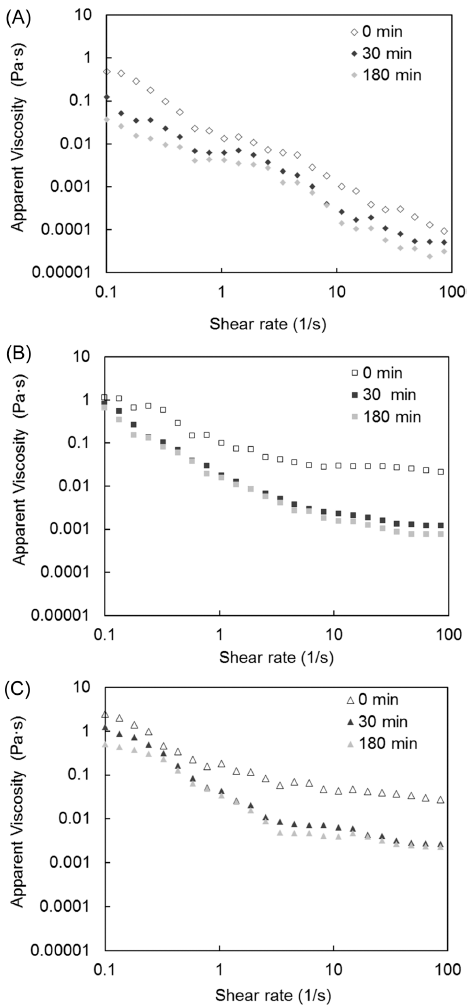
The effect of degree of gelatinization on apparent viscosity during in vitro starch digestion is illustrated in Fig. 5. The apparent viscosity values of all samples (native, partially gelatinized, and fully gelatinized) decreased as the shear rate increased; thus, all samples exhibited shear-thinning behavior, although at different levels. The increased degree of gelatinization resulted in the increase in apparent viscosity. The apparent viscosity values were higher for the gelatinized samples than for the native samples, demonstrating that apparent shear viscosity depends on degree of gelatinization.

As the in vitro starch digestion progressed (30 and 180 min), the apparent viscosity values decreased from their values in the unhydrolyzed samples (0 min), which can be explained by the hydrolysis of the starch chains by digestive enzymes. The weakening of the molecular networks in these samples due to applied shear was responsible for the observed shear thinning behavior (Ravi & Bhattacharya, 2004).
Conclusions
The effects of gel strength and gelatinization degree on starch digestibility of rice flour were investigated by in vitro starch digestion system. The relationship between starch digestibility and the gel strength with various amylose content and concentration showed that pGI negatively correlated with amylose content and concentrations of rice cultivars, but gel strength showed a positive correlation with these parameters. The amylose content correlated strongly with gel strength, whereas in vitro starch digestibility of the rice cultivars was more affected by rice flour concentration than by amylose content. Especially, in the results of starch digestion of high amylose rice with different degree of gelatinization, partial and full gelatinization changed the enzymatic digestion behavior and showed the structural disruption and low-molecularweight distribution. There results might be efficiently explained that the degree of gelatinization due to structural difference affected the starch digestibility of rice.