Introduction
Corn silk (Zea mays L.) is a traditional herb, which has dried cut stigmata of maize female flowers that contains many bioactive compounds such as carbohydrates, proteins, vitamins, calcium, potassium, magnesium and sodium salts, volatile oils and steroids, saponins, tannins, alkaloids, flavonoids and other phenolic compounds with beneficial effects on human health (Ebrahimzadeh et al., 2008). Corn silk has been used for the treatment of several diseases with multiple pharmacological activities reported, such as antioxidant (Chen et al., 2014), antidiabetic (Guo et al., 2009; Pan et al., 2017), antitumor (Yang et al., 2014), immune enhancement (Kim et al., 2004), anti-fatigue (Hu et al., 2010), anti-obesity (Chaiittianan et al., 2016), and neuroprotective effects (Choi et al., 2014).
The operational conditions such as extracting solvent concentration, extraction time, extraction time, liquid to solid ratio, and the kind of extracting solvent for the extraction method play an important role in the conventional extraction process. Conventional solid-liquid extraction is widely used for phytochemical components, plus is safe, cheap, and easy to scale up (Mulinacci et al., 2011). Ethanol is a green solvent, environmentally friendly solvent, widely used in industry because of its low cost, easy availability, safety and biodegradability (Derrien et al., 2017).
The main advantage of response surface methodology (RSM) is reduced number of experimental trials needed to evaluate multiple variables and their interactions. Therefore, it is less laborious and time consuming than other approaches required optimizing a process (Derrien et al., 2017). Usually, it applies an experimental design such as central composite design (CCD) or Box-Behnken design (BBD) to fit a second order polynomial by a least square technique. An equation is used to describe how the test variables affect the response and determine the interrelationshipamong the variables (Liu et al., 2009).
In the present study, the Derringer’s desirability function was used to improve phytochemical contents and bioactivities of extracts from unfertilized corn silk (UCS) by simultaneous optimization of five responses. The three independent variables considered were ethanol concentration, extraction temperature and extraction time, and were optimized according to the responses of the following dependent variables: total polyphenol contents, total flavonoid contents, maysin contents, 2,2-diphenyl-1-picrylhydrazyl (DPPH) radical scavenging activities, and tyrosinase inhibition.
Materials and methods
The UCS with 28.28±0.96 μm of mean diameter was obtained from Rural Development Administration (Jeonju, Korea) in 2016, and stored it at -70°C until use.
The concentrations of ethanol used were varied from 30% to 90% (v/v), according to the experimental design. The reactor was heated at 20-60°C for 1-6 h in shaking incubator (HZQ- 311, Neuronfit, Seoul, Korea) during the extraction process. The ratio of ethanol to UCS was 30 (v/w), and 1 L flask was used for extraction.
The optimization experiment was carried out using RSM with a CCD experimental design for extraction process from UCS. The CCD as an effective alternative to full factorial design enables to gather more data with lower number of experiments. The three independent variables were ethanol concentration (X1), extraction temperature (X2) and extraction time (X3). In addition, the low, middle and high levels of each variable were designed as coded terms –1, 0, +1, respectively (Table 1). The experimental data were fitted to second-order poly nominal models to express the responses as a function of the independent variables according to following equation.
| Factors | Symbol | Code value | ||
|---|---|---|---|---|
| -1 | 0 | 1 | ||
| Ethanol concentration (%) | X1 | 30 | 60 | 90 |
| Extraction temperature (°C) | X2 | 20 | 40 | 60 |
| Extraction time (h) | X3 | 1.0 | 3.5 | 6.0 |
where, Y is the measured response variable, bo is a constant, bi, bii, and bij are the linear, quadratic, and interaction coefficients, respectively, and Xi and Xj are the levels of the independent variables.
The total phenolic content of sample was analyzed by Folin- Ciocalteu colorimetric method with modification, using gallic acid as a standard (Liu et al., 2011). An aliquot (0.5 mL) of sample was transferred to the test tubes with 5 mL distilled water. After addition of Folin-Ciocalteu reagent (5 mL) and 10% aqueous Na2CO3 solution (2 mL), tubes were vortexed. After 60 min, the absorbance was recorded at 750 nm. The total phenolic content was determined using thestandard gallic calibration curve and expressed as microgram gallic acid equivalents per gram dry mass of sample (μg GAE/g dried sample).
The total phenolic content of sample was analyzed by Chew et al. (2009) with modification. The sample (0.5 mL) was placed in a volumetric flask. Ethanol (1.5 mL) was added followed by 10% aluminium nitrate (0.1 mL), 1 M potassium acetate (0.1 mL) and distilled water (2.8 mL). The solution was mixed and the absorbance was measured at 415 nm. Calculation were based on a standard curve obtained with quercetin. The total flavonoid content was expressed as micrograms of quercetin equivalents per gram of dry mass sample (μg QUE/g dried sample).
Maysin contents were analyzed by HPLC; the operation conditions are described in Table 2. Standard maysin was obtained from Rural Development Administration, which was conformed by electrospray ionization-mass spectrometry (ESI-MS) using Micromass Electrospray Interface ZMD 4000 (Micromass, Manchester, UK). The maysin contents of the sample were measured by comparison retention time of standard maysin, and calculated based on the peak area of standard maysin (Kim et al., 2000).
A 0.2 mL of sample was added to 1 mL of 0.2 mM DPPH methanol solution, mixed, and allowed to stand for 30 min in the dark. Distilled water was used as a blank control. The percent inhibition of absorbance at 517 nm was calculated and plotted as a function of the concentration of standard for samples to determine the ascorbic acid equivalent antioxidant concentration (Sarepoua et al., 2013). The percentage of DPPH radical scavenging activity of sample was calculated according to the following equation.(2)
Where, A is the absorbance of sample and B is the absorbance of control.
Tyrosinase inhibition of samples was analyzed using the method reported by Kwon et al. (2012). A 0.2 mL of sample was added to 2.3 mL of 0.2 M potassium phosphate buffer (pH 6.5) and 0.4 mL of 2 mM l-tyrosine solution. The solution was mixed and 0.1 mL mushroom tyrosinase (220 unit/mL) was added. After 20 min of reaction in 37°C water bath, the absorbance was recorded at 470 nm (A). The absorbance of 0.1 mL of distilled water instead of enzyme solution (B) and that of 0.2 mL of distilled water instead of the sample (C) were measured. Tyrosinase inhibition was then calculated according to the following equation.(3)
Each experiment was performed in triplicate, and statistical analysis was performed using SAS version 9.3 (SAS Institute Inc., Cary, NC, USA) software. Regression and variance analyses were carried out using RSREG procedure. Both carnonical and ridge analyses were conducted in addition to the Derringer’s desirability function, known as an efficient method for optimization of multiple responses.
Results and Discussion
According to the CCD, 15 experiments were performed in triplicate and the obtained results are presented in Table 3. The experimental results of investigated responses (total polyphenol contents, total flavonoid contents, maysin contents, DPPH radical scavenging activity and tyrosinase inhibition) obtained under different ethanol concentrations, extraction temperatures and extraction times were fitted to a second order polynomial model (Eq. (1)), and multiple regression coefficients were generated for all responses, using a least square approach in Table 4. Their statistical significance based on determination coefficients and probability values for each investigated response are summarized in Table 5. For each terms in the models, a large determination coefficient or F value and a small Pr value would imply a more significant effect on the respective response variable (Yolmeh et al., 2014). According to statistically significant values of total regress (p<0.05) for all investigated responses, it was possible to conclude that applied mathematical model provides proper representation of experimental results. All of linear, quadratic and interactive coefficients were significant (p<0.05) for all responses except interactive coefficients of total flavonoid contents (p>0.05).
Corn silk is rich in phenolic compounds known to significantly benefit human heath, such as anthocyanins, pcoumaric acid, vanillic acid, proto-catechuic acid, derivatives of hesperidin and quercetin, and bound hydroxycinnamic acid forms composed of p-coumaric and ferulic acid (Ebrahimzadeh et al., 2008). The UCS used in this study had over 20 times higher maysin contents than commercial corn silk (unpublished data). The pharmacological effects of corn silk, such as antioxidant, anti-inflammatory or diuretic activity, are attributed to the presence of these phenolic compounds in it (Liu et al., 2011).
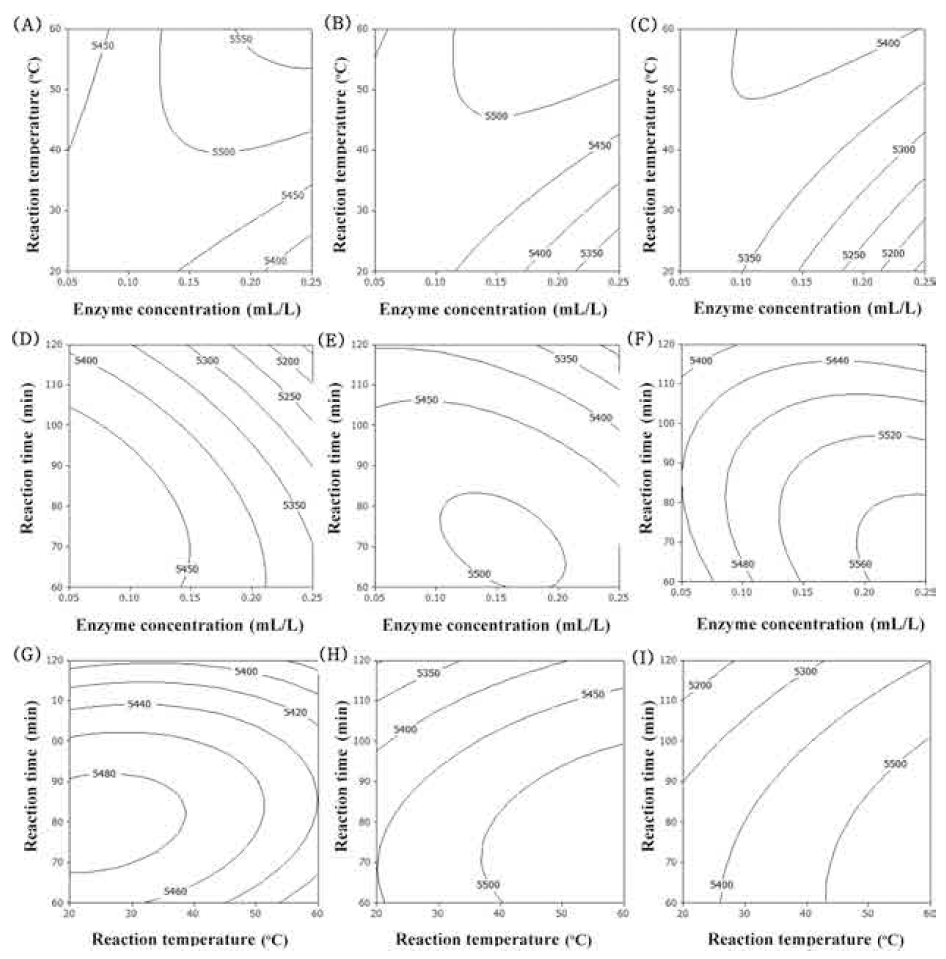
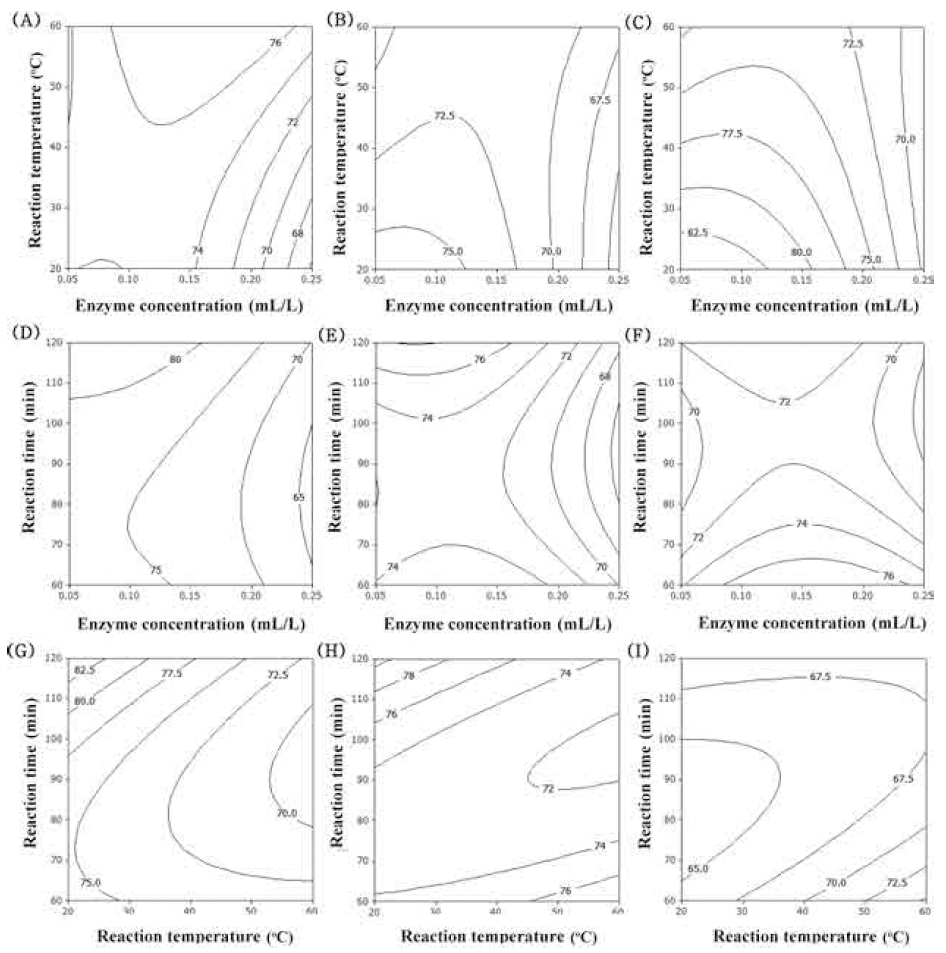
Accordingly, surface response plots of the model would allowfor visualizing the effect of the independent variables on the dependent variables by adjusting two of the factors simultaneously and keeping the third variable constant at the - 1, 0, and 1 level. The contour plot for total polyphenol contents of extracts from UCS as functions of ethanol concentration, extraction temperature and extraction time (Fig. 1). In the case of total polyphenol contents, optimum range of ethanol concentration was around 60% (Fig. 1A-F). Increasing extraction temperature increased total polyphenol contents (Fig. 1A, B, C, G, H, I). Increasing extraction time just a little increased total polyphenol contents (Fig. 1G-I). The most significant factor for total polyphenol contents was ethanol concentration as shown in Table 6. The second and third factors were extraction temperature and extraction time, respectively.
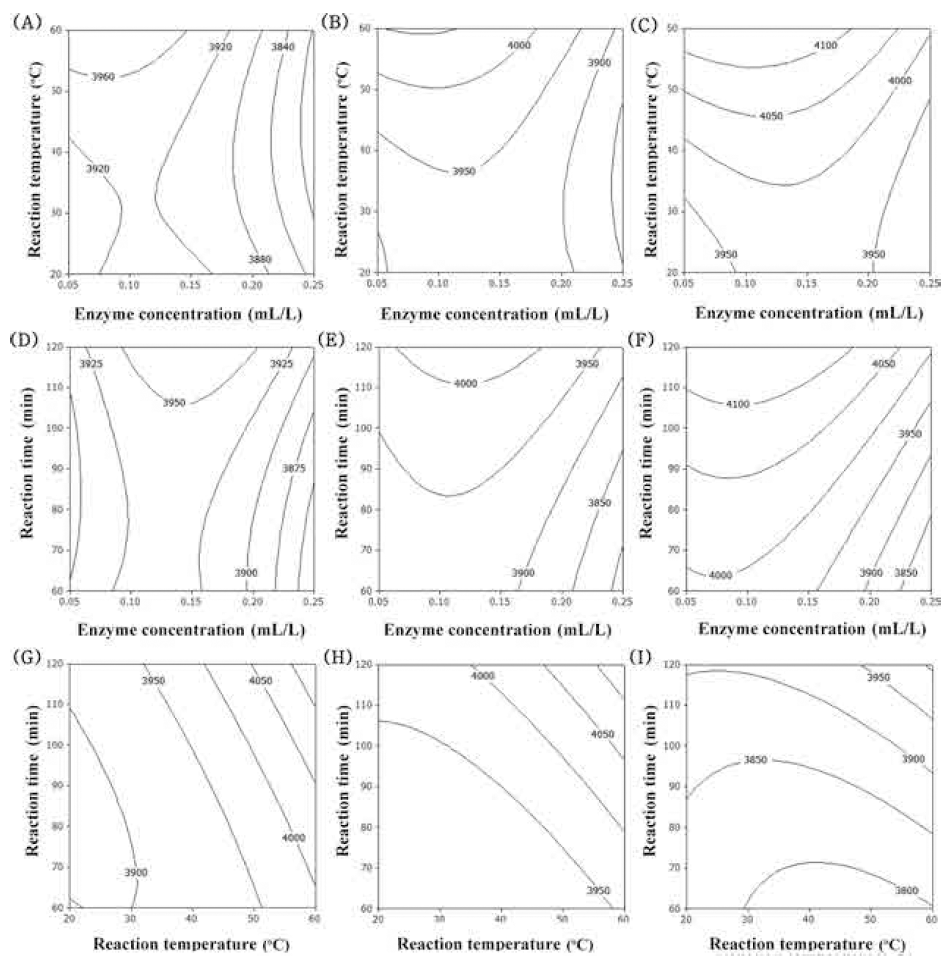
The flavonoid compounds of corn silk are major constituents which can scavenge the DPPH radical, due to the presence of the hydroxyl groups in their structure and their electron donating ability (Liu et al., 2011). The flavonoid compounds of corn silk were mainly composed of luteolin, formononetin and apigenin (Yu et al., 2008). The contour plot for the total flavonoid contents of extracts from UCS as functions of ethanol concentration, extraction temperature and extraction time is shown in Fig. 2. The optimal range of ethanol concentration was around 50-60% (Fig. 2A-F). As increased extraction temperature, total flavonoid contents was increased (Fig. 2A, B, C, G, H, I). Extraction time had not affected on total flavonoid contents (Fig. 2D-I). The most significant factor influencingthe total flavonoid contents was ethanol concentration as shown in Table 6, followed by extraction temperature and extraction time. The effect of extraction time on total flavonoid contents did not show significant differences (p>0.05).
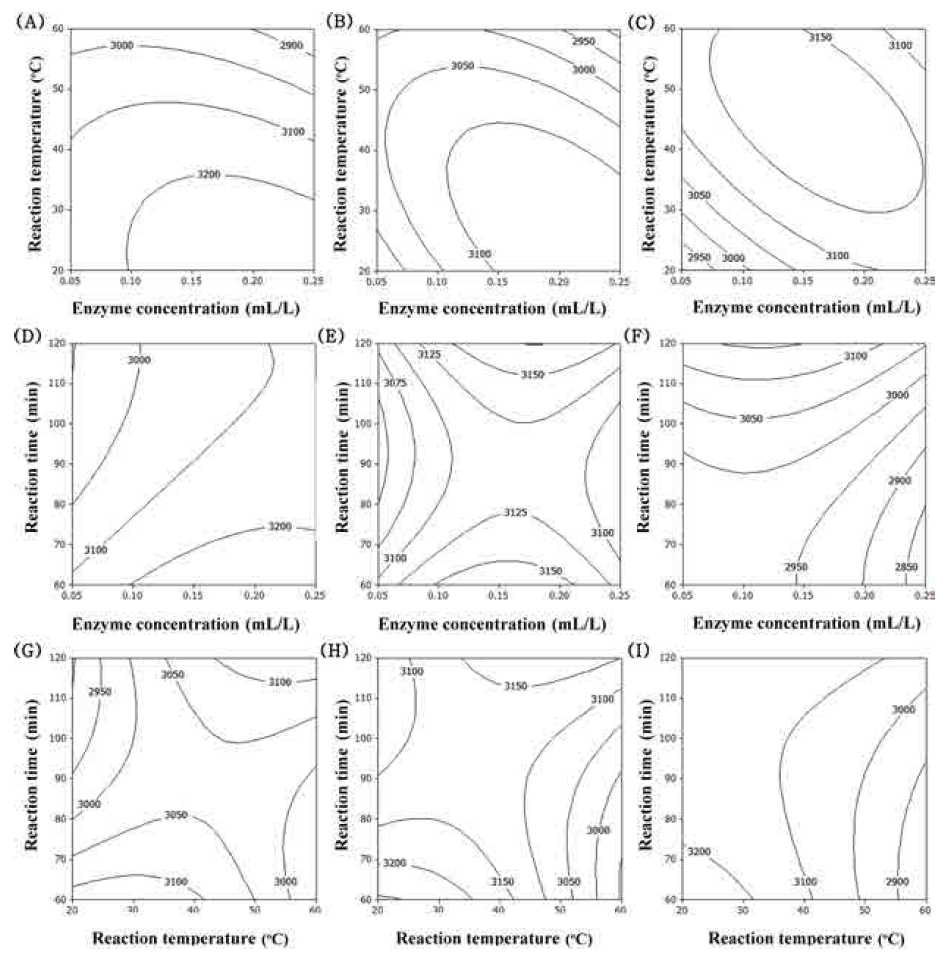
The predominant phenolic compounds in corn silk extracts have been identified as maysin, apimaysin, 3’-methoxymaysin, isoorientin, and luteolin derivatives, among which maysin [rhamnosy-6-C-(4-ketofusyl)-5,7,3’4’ tetrahydroxyflavone], a flavone glycoside containing a rhamnose residue, is the most abundant flavonoid (Lee et al., 2017). Maysin from purified corn silk acts anticancer (Lee et al., 2014), neroprotective (Choi et al., 2014), immunomodulating (Lee et al., 2014) and anti-obesity activities (Chaiittianan et al., 2016). The contour plot for maysin contents of extracts from UCS as functions of ethanol concentration, extraction temperature and extraction time is shown in Fig. 3. The optimal range of ethanol concentration was around 70-90% (Fig. 3A-F). Extraction temperature and extraction time had not affected on maysin contents is shown in Fig. 3. The most significant factor influencing the maysin content of extracts from UCS was the ethanol concentration, as shown in Table 6, followed by extraction temperature and extraction time. Reaction time did not have a significant effect on maysin contents (p>0.05).
DPPH radical scavenging activity, based on the reduction of DPPH solution in the presence of a proton-donating substance, has been extensively employed to evaluate the radical scavenging ability of samples (Zeng et al., 2014). The DPPH radical scavenging activity of corn silk was shown to be related to the content of total polyphenol compounds (R=0.9415) and total flavonoids (R=0.9546) (Liu et al., 2011). The contour plot for DPPH radical scavenging activity of extracts from UCS as functions of ethanol concentration, extraction temperature and extraction time is shown in Fig. 4. Increasing ethanol concentration increased DPPH radical scavenging activity (Fig. 4AF). With increased reaction temperature, DPPH radical scavenging activity was also increased (Fig. 4A, B, C, G, H). The most significant factor influencing DPPH radical scavenging activity of extracts from UCS was ethanol concentration, as shown in Table 6, followed by extraction temperature and extraction time.
There is an increased interest in finding natural tyrosinase inhibitors from herbs and applying them as skin care products, which have become potential sources of skin whiteners. Antioxidants are good inhibitors of tyrosinase activity and melanin production, and certain antioxidants have been applied as melanogenesis inhibitory agents (Yang et al., 2015). The contour plot for tyrosinase inhibition of extracts from UCS as functions of ethanol concentration, extraction temperature and extraction time is shown in Fig. 5. In the case of tyrosinase inhibition, optimum condition of ethanol concentration was 90% (Fig. 5A-F). As decreased reaction temperature and increased extraction time, DPPH radical scavenging activity was increased (Fig. 5). The most signifi- cant factor for tyrosinase inhibition was ethanol concentration, as shown in Table 6, followed by reaction temperature and traction time.
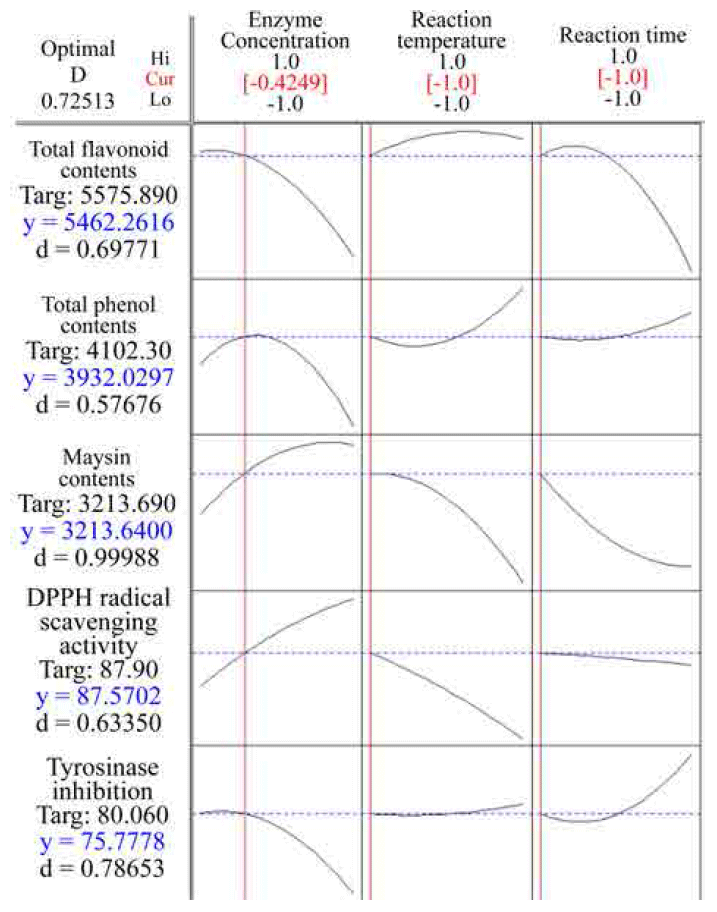
It is relatively simple to find the optimal conditions for a single response using RSM; however, in this study we sought to optimize five responses. Consequently, a Derringer’s desirability function was utilized to optimize several responses simultaneously. The procedure involves constructing a function of each individual desirability diand then obtain an overall desirability function D. The function D is then used to maximize the ability of choosing the best conditions for the designated variable. The overall desirability function D is defined as the weighted geometric average of the individual desirability (di), according to following equation (Vera- Candioti et al., 2007).(4)
where, d1, d2, d3, ...., dm correspond to the individual desirabilities function for each response.
Therefore, the optimal extraction process for improving the phytochemical contents and bioactivities from UCS were simultaneous optimized with the Derringer’s desirability function using the numerical optimization function of the Design- Expert program. Response optimization for multi-responses of extracts from UCS are shown in Fig. 6. The optimum conditions given by the model were as follows: ethanol concentration 80.45%, extraction temperature 53.49°C, and extraction time 4.95 h, respectively. Under these conditions, the model predicted the values of total polyphenol contents, total flavonoid contents, maysin contents, DPPH radical scavenging activity and tyrosinase inhibition were 2758.74 μg GAE/g dried sample, 1520.81 μg QUE/g dried sample, 810.26 mg/100g dried sample, 56.86% and 43.49%, respectively, and the overall desirability (D) was 0.74.