Introduction
Surfactants are commonly used in personal, home, and industry care products. Surfactants contain both hydrophilic and hydrophobic structures and act as detergents, wetting agents, emulsifiers, foaming agents, and dispersants (Rang, 2009; Lee et al., 2012). Commercial products are generally composed of more than two types of surfactants among the four classes anionic, amphoteric, non-ionic, and cationic depending on their chemical structures and functions (Im et al., 2008). Four major structures of surfactants are known: hexagonal, lamellar, reverse hexagonal, and cubic (Tiddy, 1980). Surfactant mixtures that are commonly used in many practical applications form mixed micellar aggregates that frequently exhibit characteristic properties; such micellar aggregates are remarkably different and have superior performance to those of the individual components. The synergistic behaviors of mixed surfactant systems may be exploited to reduce the total amount of surfactant used in particular applications, thereby reducing the cost and environmental impact (Shiloach & Blankschtein, 1998). Mixtures of ionic and non-ionic surfactants are commonly used in many practical surfactant applications because the solution behaviors of these surfactants are complementary and ideal for laundry detergent formulation sowing to their tolerance to hard water (Holland & Rubingh, 1993; Kang, 2011). Several analytical methods have been reported for analyzing surfactants; these include colorimetric methods, planar chromatography, gas chromatography (GC), highperformance liquid chromatography (HPLC), and capillary electrophoresis (CE) (Toshio et al., 1970; Song et al., 1998; Levine et al., 2005). Anionic surfactants are usually assessed via spectrophotometric methods using methylene blue; this standard method is used to determine the surface agents in tapwater samples (ISO, 2012). However, this official method is not only time-consuming and tedious but also requires significant quantities of chloroform and the sample (Jurado, 2006). The separation and analysis of a homologous series of long-chain fatty acids by HPLC has been carried out by first preparing UV-absorbing derivatives. Although HPLC separation with UV detection is the most common practical method, it is not sensitive enough to detect low levels of surfactants in samples (Nicholas, 1978). The oligomer distribution of lowermolecular- weight ethoxylates can be determined using GC; however, to increase its volatility, the analyte must first be derivatized or cleaved (Thomson et al., 1995). A method using an ultraviolet absorption spectrometer is simple and rapid for the analysis of surfactants, but the limits of detection are low. Because of these drawbacks, it is difficult to apply these methods in public institutions and industry (Kim et al., 1996; Wangkarn et al., 2005; Choi et al., 2008). Among the surfactants available, a recent survey showed that the most common surfactants are linear alkylbenzenesulfonate (LAS), sodium lauryl sulfate (SLS), and alpha olefin sulfonate (AOS) (MFDS, 2012). Anionic surfactants are currently the most common type used and are incorporated in the majority of detergent and cleaning-product formulas for daily use. In particular, LAS derivatives are the most commonly used synthetic anionic surfactants. They have been extensively used for over 30 years with an estimated global consumption of 2.8 million tons in 1998 (Ying, 2006). Therefore, this study aims to validate microanalysis methods for the determination of commonly consumed surfactants. We validate the method by determining the linearity, limits of detection, limits of quantification, recovery, precision, and accuracy. Also, we monitored the surfactant content of local detergents using this method.
Material and Method
An Agilent 1100 HPLC system (Agilent, Palo Alto, CA, USA) equipped with a Zorbax ODS C18 (4.6 mm×150 mm × 5 μm) column (Waters, Milford, MA, USA) and a fluorescence detector (FLD) from JASCO (Tokyo, Japan) was used for LAS microanalysis. SLS determination was performed using an Agilent 1100 HPLC system (Agilent, Palo Alto, CA, USA) equipped with a Zorbax ODS C18 (4.6 mm×150 mm×5 μm) column (Agilent, Midland, MI, USA) and a differential refractive index detector (RID) from Agilent (Midland, MI, USA). To determine AOS, an Agilent 1100 HPLC system (Agilent, Palo Alto, CA, USA) equipped with a J’sphere ODS H-80 (4.6 mm×250 mm×4 μm) column (Wakosil II, Tokyo, Japan) and an evaporative light scattering detector (ELSD) from Agilent (Agilent, Midland, MI, USA) were used (Table 1).
A commercial LAS mixture (C (Carbon unit)10, C11, C12, and C13) from LG Chem Ltd. (Seoul, Korea), SLS standard (C12) from Henkel Korea (Seoul, Korea), and AOS standard (C14) from Aekyung (Seoul, Korea) were used as the sources of anionic surfactants. HPLC-grade methanol and water were purchased from Burdick & Jackson (Agilent, Midland, MI, USA). The other organic solvents and reagents were HPLC and analytical-reagent grade, respectively.
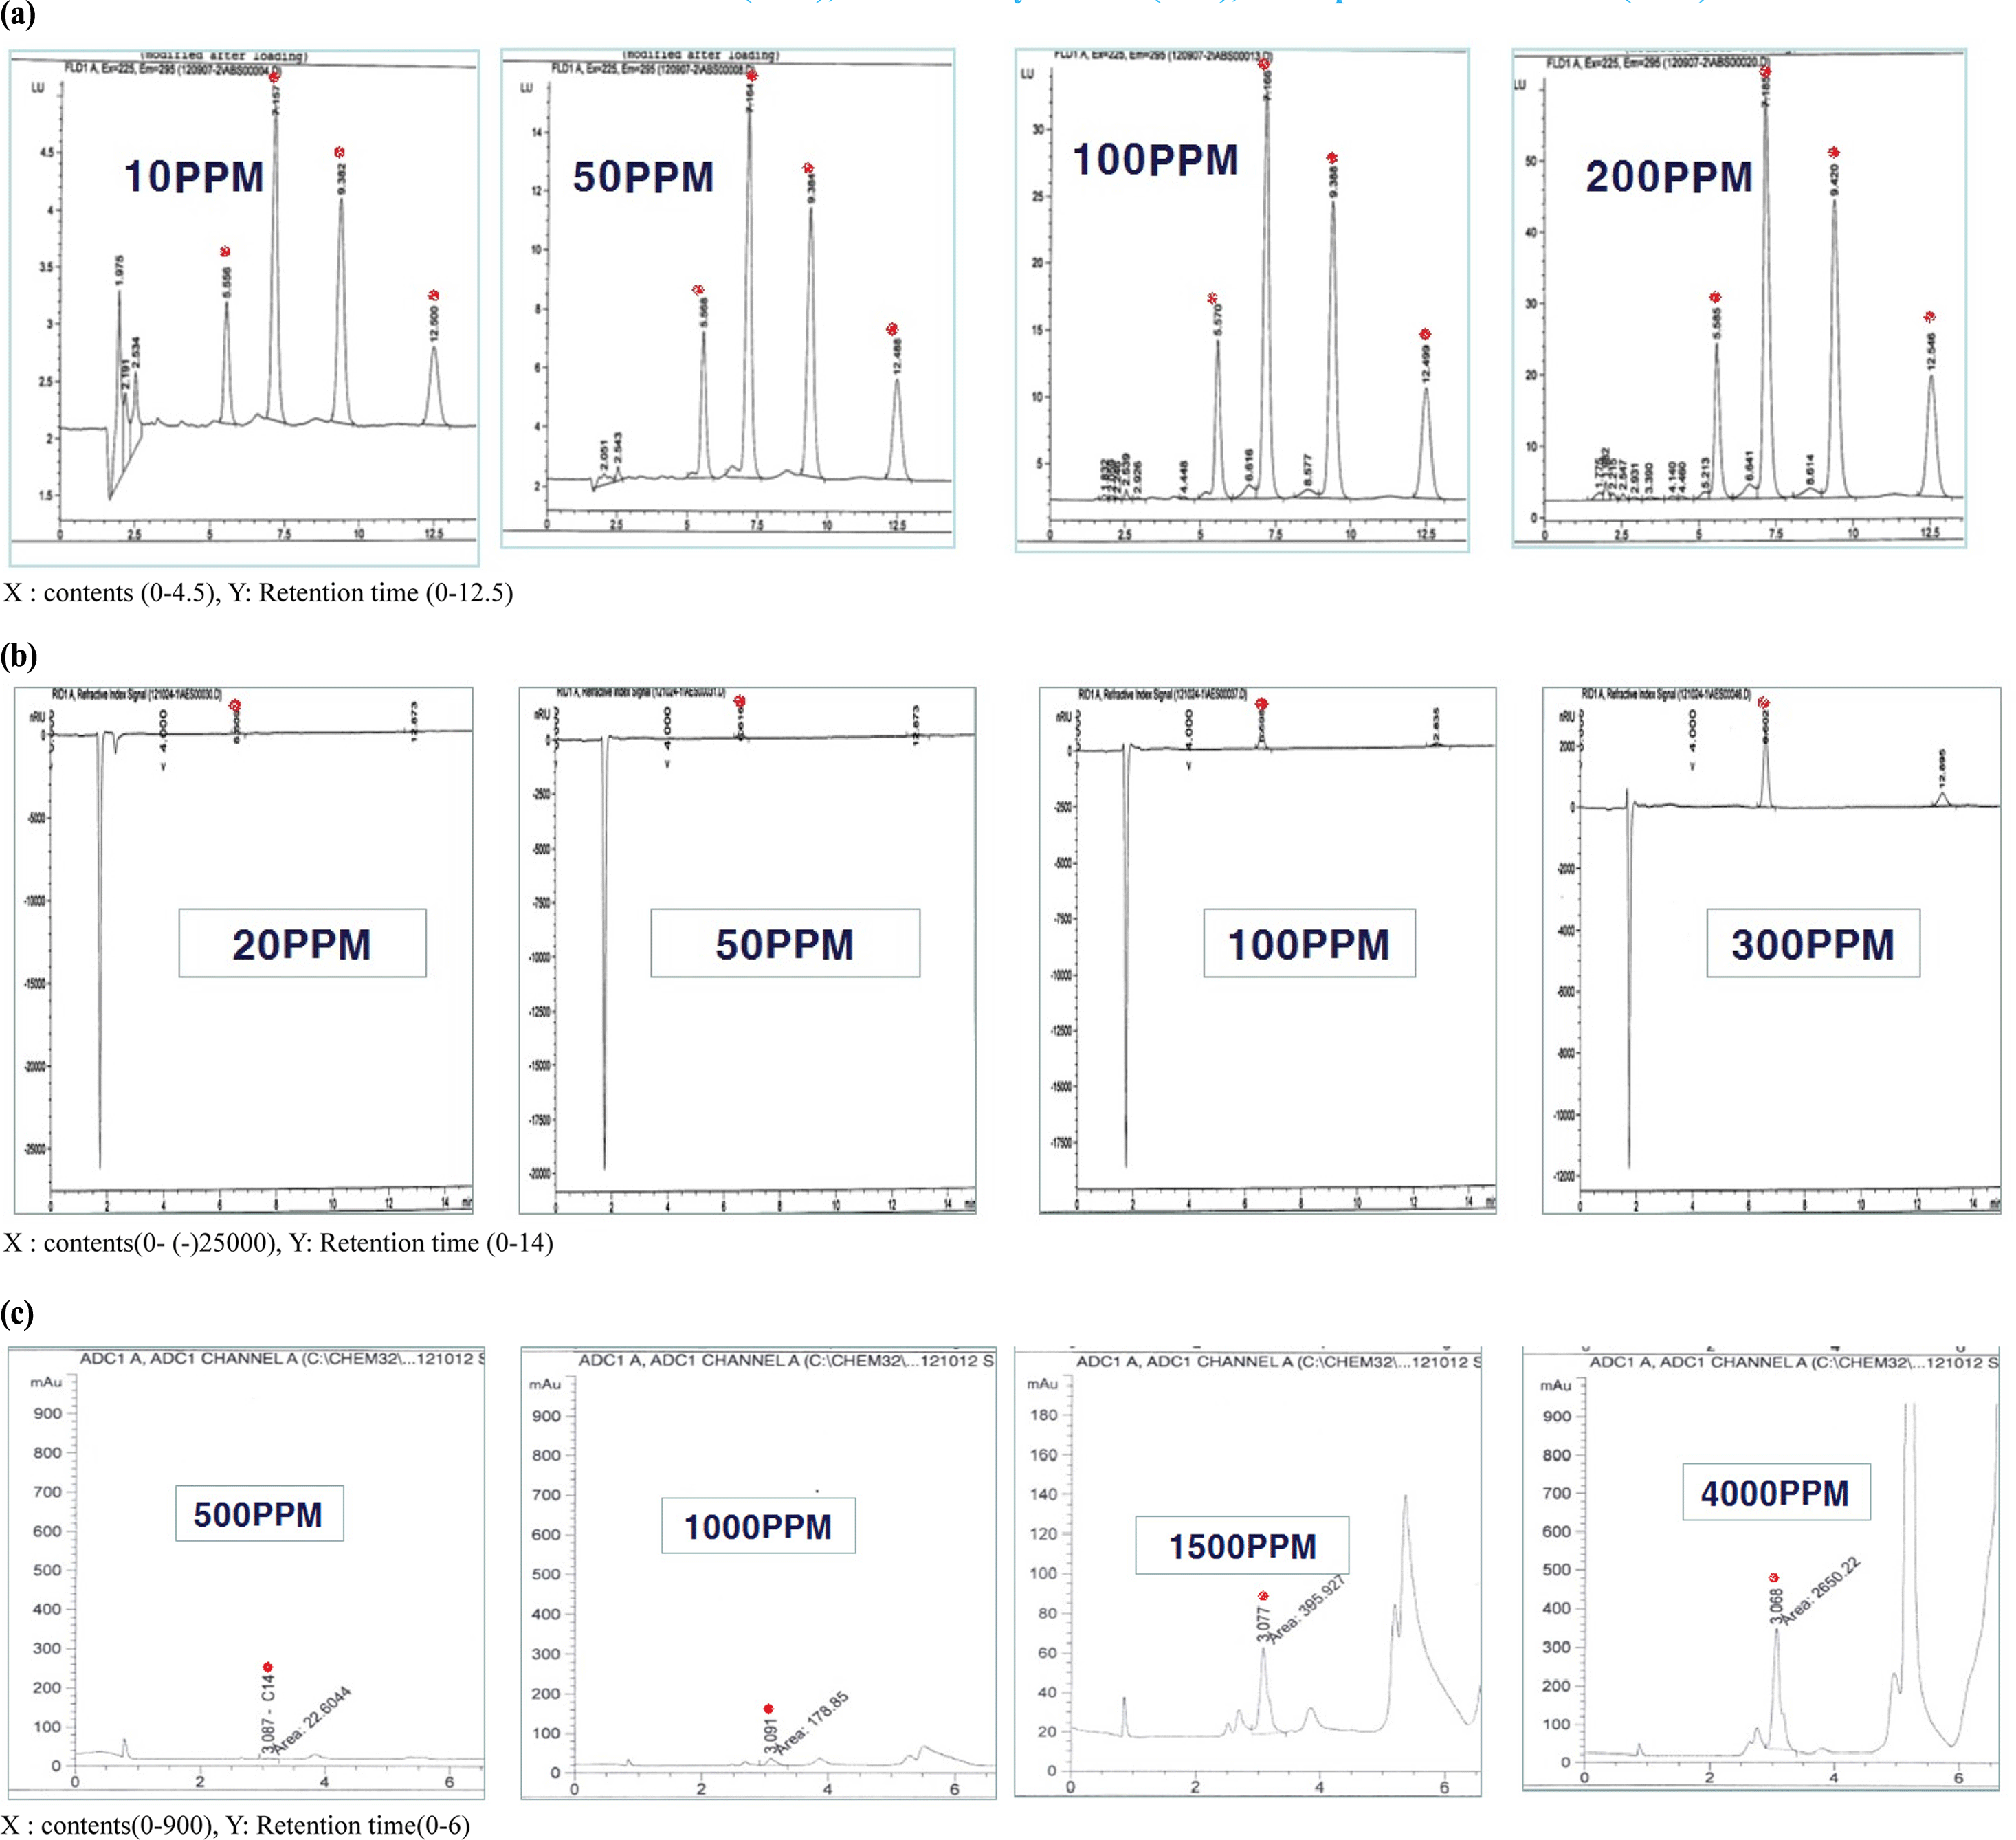
Calibration curves were prepared by diluting each standard stock solution with mobile phase to 10, 20, 150, and 200 mg/L for LAS; 10, 50, 100, 200, and 300 mg/L for SLS; and 500, 1000, 1500, and 4000 mg/L for AOS. For each compound, the external standard calibration curve was generated using data points.
The LOD and LOQ values of the method were determined by injecting each standard solution at the LOD and LOQ to determine the minimal detectable concentration. The LOD was defined as the lowest analysis concentration that yields a signal-to-noise (S/N) ratio of 3, while the LOQ was defined as the lowest analysis concentration that yields an S/N ratio of 10. The S/N ratio was measured using chemstation software (Agilent, Midland, MI, USA).
The recovery was determined by analyzing 100 mg/L LAS, SLS, and AOS standard solutions to detergent and calculated using the following equation:
(A1 − A2)/A3 × 100
where A1 is the result obtained when the standard solution was used, A2 is the result obtained when the standard solution was not used, and A3 is the amount of standard solution used.
The precision was tested by analyzing nine injections of a 100 mg/L standard solution and calculating the relative standard deviations (RSDs) of the retention times and peak areas. The accuracy was determined using the standard addition technique. The accuracy of the method for estimating detergent content was evaluated using a certification sheet based on the standard solution. Samples were added to 1 mL of 100 mg/100 g standard solution and analyzed quantitatively; the results were compared to those for samples that did not contain the standard solution.
Results and Discussion
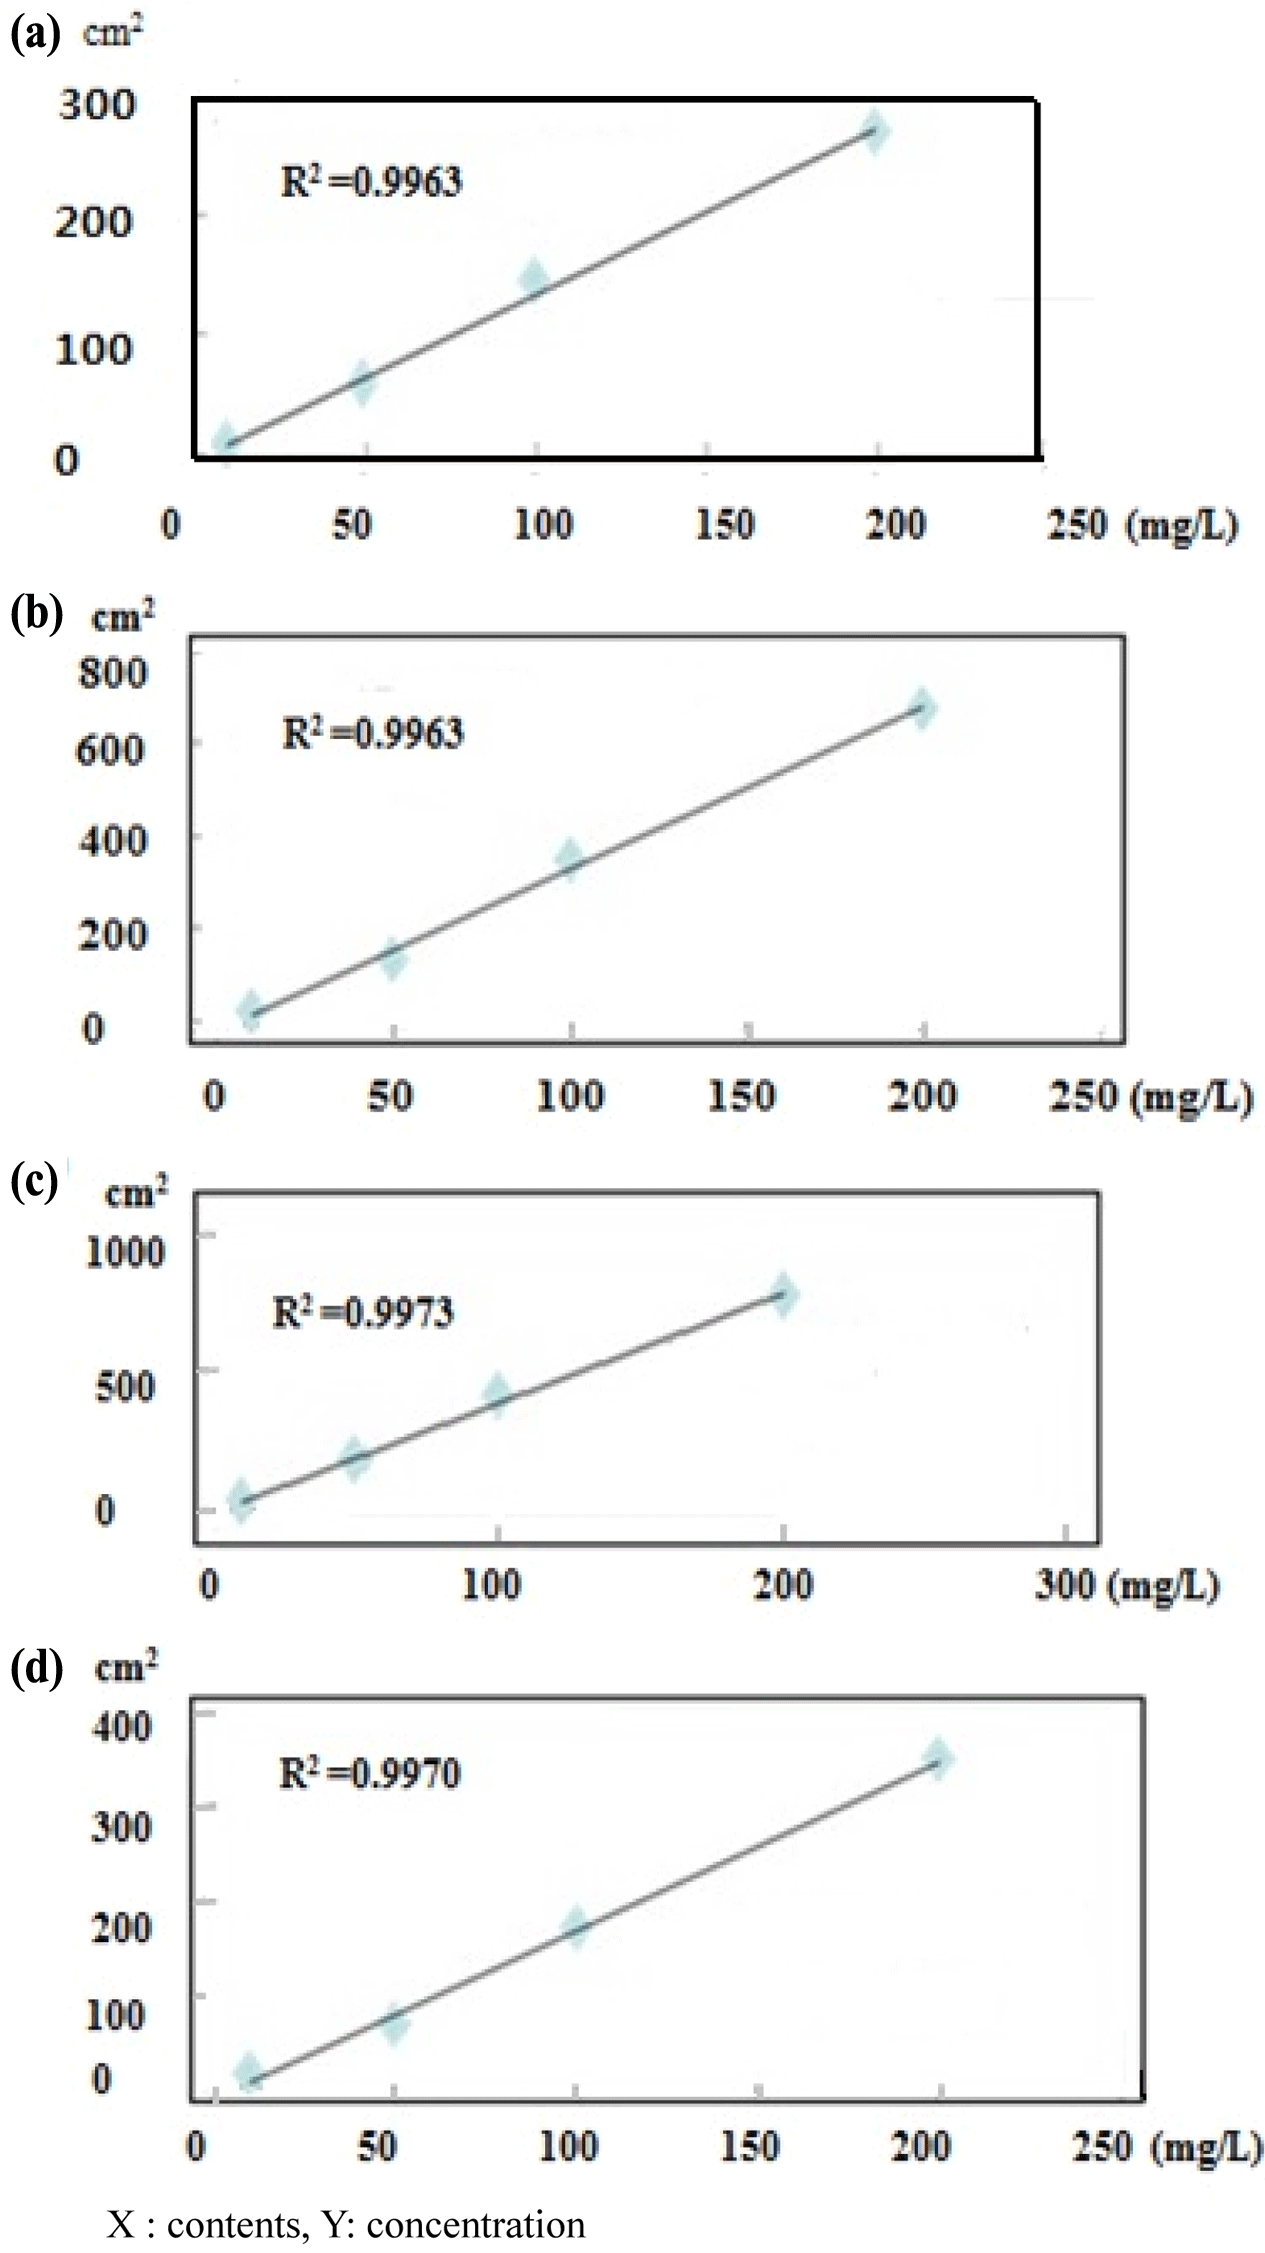
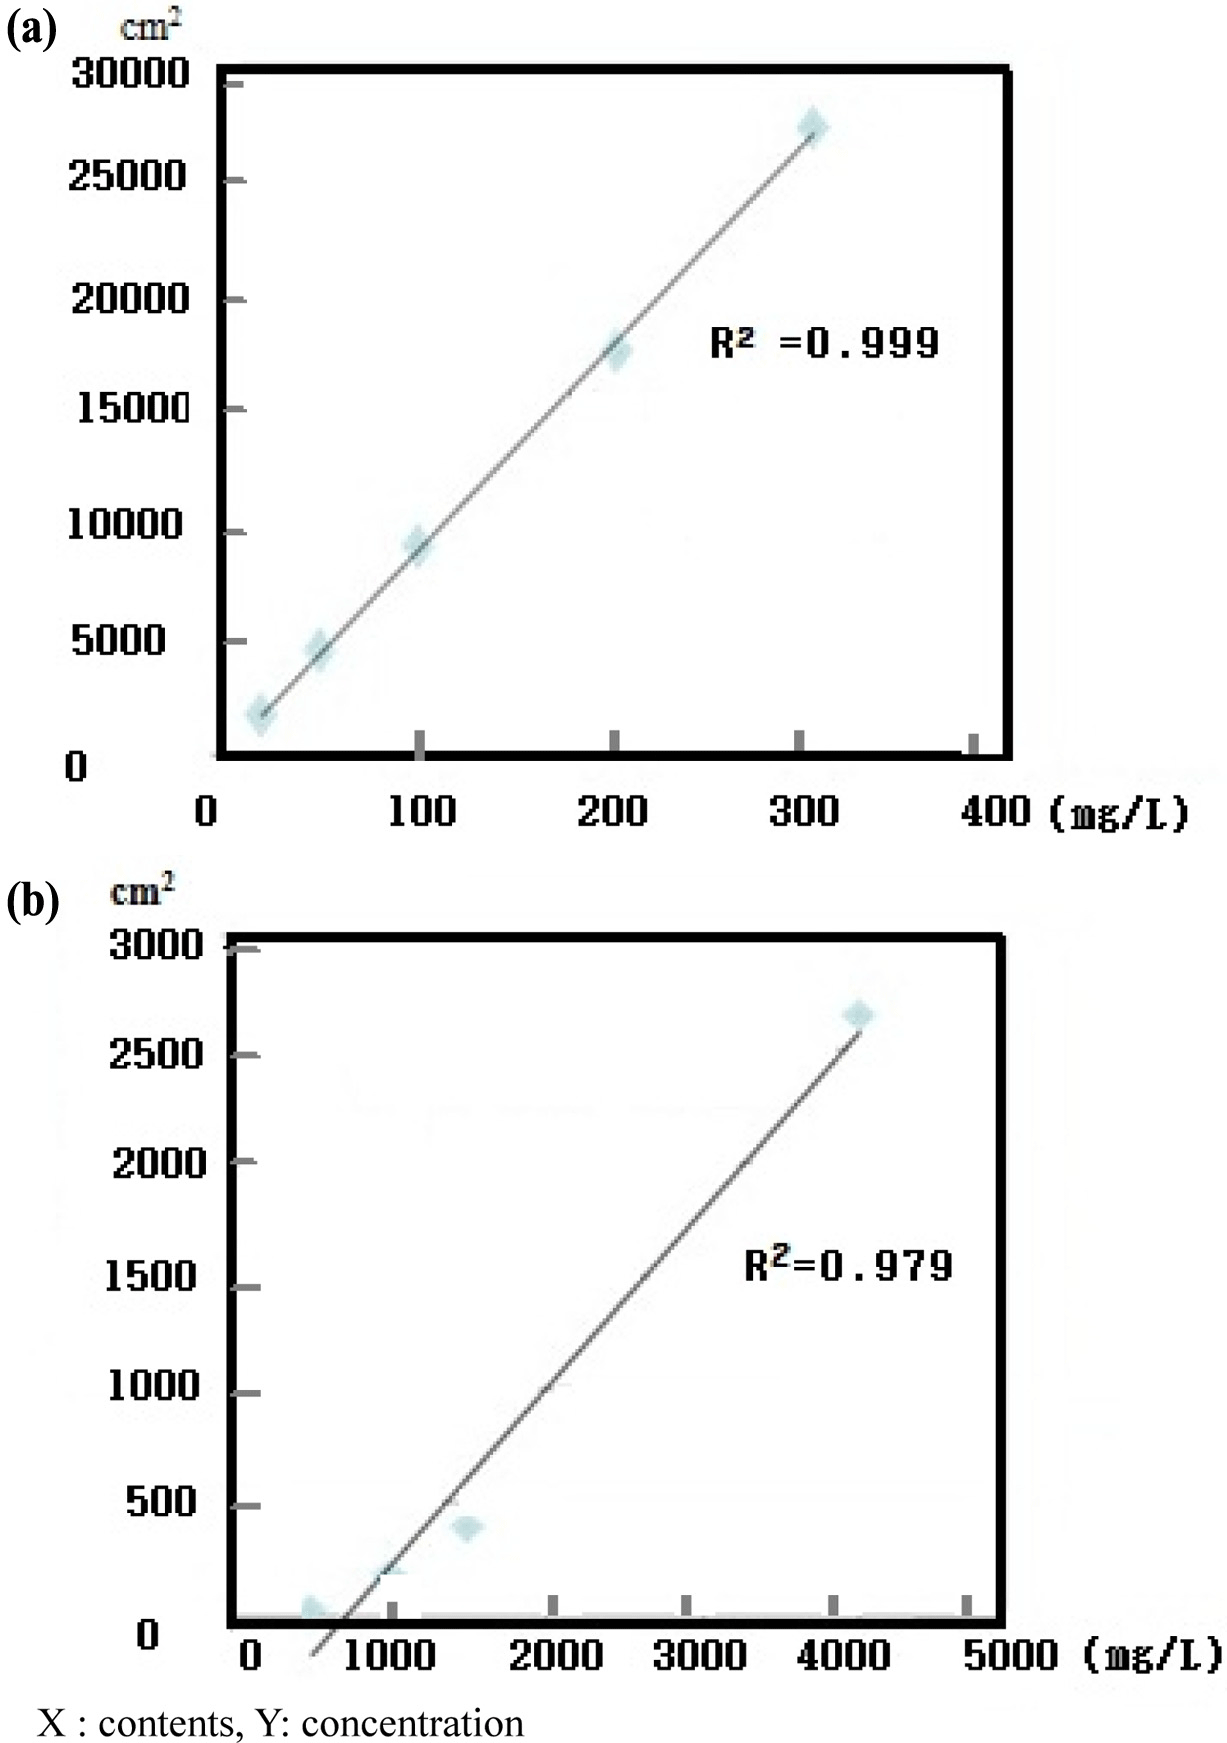
An LAS mixture (C10, C11, C12, and C13) and SLS standard (C12) were diluted to 10-300 mg/L to confirm the correlativity standard confirmation and peak area. Each detector response was linear over the concentration ranges tested (i.e., 10, 50, 100, and 200 mg/L) and all calibration curves had correlation coefficients higher than 0.995 (Fig. 1). The AOS standard (C14) was diluted to 500-4,000 mg/L. The response of the detector with ELSD was linear over the concentration ranges tested (500, 1000, 1500, and 4,000 mg/ L). The calibration curves of LAS C10, C11, C12, and C13 had correlation coefficients of 0.995, 0.997, 0.996, and 0.997, respectively. The calibration formulas for LAS C10, C11, C12, and C13 were y=1.384x − 0.570, y=3.913x − 2.359, y=3.492x − 10.25, and y=1.798x − 10.93, respectively (Fig. 2). For SLS, the correlation coefficient was 0.9994 and the calibration formula was y=90.07x − 39.71. For AOS, had a correlation coefficient of 0.9940 and calibration formula of y=0.786x − 564.5 (Fig. 3).


LOD and LOQ values for LAS, SLS, and AOS were shown in Table 2. LOD were 0.21 mg/L, 0.09 mg/L, 0.11 mg/L and 0.56 mg/L, and LOQ were 0.70 mg/L, 0.30 MG/l, 0.37 mg/L and 1.87 mg/L in LAS C10, C11, C12 and C13. LOD data was 0.07 mg/L and LOQ was 2.33 mg/L in SLS C12. LOD was 16.55 mg/L and LOQ was 21.83 mg/L in AOS.
LAS, SLS, and AOS standards were prepared by spiking LAS, SLS, and AOS free samples of detergents with LAS, SLS, and AOS to achieve concentrations of 100 mg/L. After spiking the samples with the LAS mixture, LAS peaks were detected at retention times of 4.66, 5.82, 7.47, and 9.69 min for LAS C10, C11, C12, and C13, respectively. In the samples spiked with SLS, an SLS peak was detected at a retention time of 6.58 min for SLS C12. After the addition of AOS standard, an AOS peak was detected at a retention time of 3.06 min for AOS C14. The recoveries were 98.84%, 98.07%, 98.75%, and 97.17% for LAS C10, C11, C12, and C13, respectively, using HPLC with FLD. The recoveries for SLS C12 and AOS C14 were 97.94% and 96.11%, respectively, using HPLC with RID (Table 3).
To assess the precision of the method, bulk sample solutions were prepared as per the test method by spiking to the target test concentration (100 mg/L) and calculating the RSD values. The obtained precision values were 0.50%, 0.57%, 0.95%, and 0.20% for LAS C10, C11, C12, and C13, respectively. For SLS C12 and AOS C14, the precision values were 0.30% and 0.10%, respectively (Table 3). The accuracy of the determination of LAS from spiked samples of LAS, SLS, and AOS was investigated. Samples were prepared in triplicate at each level by spiking bulk solution with LAS, SLS, and AOS at different concentrations. As determined using HPLC with FLD, the accuracy values were 0.69%, 0.49%, 0.45%, and 0.79% for LAS C10, C11, C12, and C13, respectively. Using HPLC with RID, the accuracy was 0.93% for SLS C12 and 0.83% for AOS C14 with HPLC-ELSD. We found a similar level of precision as previous reports (Villar et al., 2009) (Table 3).
Local detergent samples (A, B, C and D) were analyzed to confirm their contents of LAS, SLS, and AOS. Detergent samples were measured for LAS using HPLC-FLD, SLS using HPLC-RID, and AOS using HPLC-ELSD. Sample A contained 1.32, 1.60, 1.09, and 1.21 mg/L LAS C10, C11, C12, and C13 and AOS was undetectable amount. In contrast, sample B contained 174.20 mg/L of SLS C12, 322.15 mg/L of AOS C14, and LAS was undetectable amount. Sample C contained 121.92, 126.78, 114.34, and 108.58 mg/L of LAS C10, C11, C12, and C13, respectively, and undetectable amounts of SLS and AOS. Sample D contained 101.34, 100.30, 91.18, and 100.85 mg/L LAS C10, C11, C12, and C13, respectively, 37.84 mg/L SLS C12, and an undetectable amount of AOS (Table 4).
Conclusion
In this study, an analytical method for the determination of LAS, SLS, and AOS using HPLC was designed. The method was validated via the linearity, limit of detection (LOD), limit of quantification (LOQ), recovery, precision, and accuracy using HPLC with FLD, RID, and ELSD. The proposed methods were successfully applied for the detection of linear alkylbenzenesulfonate (LAS), sodium lauryl sulfate (SLS), and alpha olefin sulfonate (AOS). With optimal recoveries and precision, and the compounds could be detected in a few micrograms per liter. This method may be suitable for the analysis of surfactants; thus, the analysis methods discussed in this paper can be utilized in a variety of industries.